The factors, their levels and values along with the ANOVA
table are shown in Table 2 below.
Table 2: Analysis of Variance
International Journal of Scientific & Engineering Research, Volume 5, Issue 5, May-2014 21
ISSN 2229-5518
Application of DOE to Determine the Factors
Affecting the Time of Downloading Using Torrent
Technology
Ruwaid Arab
Abstract— a common misconception between average users is that the download speed using torrent software’s depends solely on the internet speed. We wanted to study the factors affecting the time of downloading a particular file via torrent technology. The objective was to find out what are the main factors that affects the time of downloading. We wanted to find the levels of these significant factors at which the files takes the least time to complete downloading. For the experiment, we chose a 4Mb speed connection to conduct the experiment and used a fixed file size of 10.33 Mb file. The results is that we recommend using Utorrent as a software and download in the morning with as much seeds as pos- sible to achieve higher download speed.
Index Terms— 2k factorial design, Analysis of Residual, ANOVA, Design of Expermints (DOE), Statistical Analysis, Torrent.
—————————— ——————————
common misconception between average users is that the download speed using torrent software’s depends solely on the internet speed. We wanted to study the fac-
tors affecting the time of downloading a particular file by tor- rent technology. The objective was to find out what are the main factors that affects the time of downloading. We wanted to find the levels of these significant factors at which the files takes the least time to complete downloading. For the exper- iment, we chose a 4Mb speed connection to conduct the exper- iment and used a fixed file size 10.33 Mb file.
2 PRE-EXPERIMENTAL ANALYSIS
A pre-experimental analysis was done to determine the objec- tive, the factors and the experiment design as follow:
The objective was to find the main factor affecting the time of downloading a file using torrent technology.
We prepared a list of factors that may affect the time of down- loading a file via torrent client. The factors identified were:
1. The time of the day: the time of downloading during the day. ‘Morning’ or ‘afternoon’ or 'evening'. So the three levels in this factor would be: Morning, Afternoon and Evening
2. Torrent Client: will conduct the experiment by using
three torrent Clients. So, Will have three levels Azureus, utorrent and Bittorrent
3. Seeder: the number of people actually seeding the file not the total number of seeders. Will have also three levels 1-
2, 3-4. 5-6 seeders
There were some other factors that were constant:
We chose a 4Mb speed to conduct the experiment.
We decide to conduct the experiment on a 10.33Mb file. So every time will download the same file size.
We selected the response variable as the ‘time taken to down- load a particular file'.
We decided to choose the three main factors cited above. Thus three are three main factors to be considered in this experi- ment as described. Each of the factors has three levels. We are considering the Taguchi design for this experiment. We have 3 factors and 3 levels for each factor so Taguchi design is the appropriate choice plus we will a have a signal 1 for upload- ing files while conducting the experiment and 0 for not down- loading file while conducting the experiment. The number of replication for the experiment will be one and it will take ap- proximately one day to conduct the experiment.
Hypothesis statement 1
loading time
loading time
The above statement is mathematically expressed as:
μ1, μ2 and μ3 are the mean times taken for downloading in the morning, afternoon and evening.
IJSER © 2014
22
International Journal of Scientific & Engineering Research Volume 5, Issue 5, May-2014
ISSN 2229-5518
Hypothesis statement 2
The above statement is mathematically expressed as:
Ho: μ1 = μ2 = μ3
H1: at least any one μ is different
μ1, μ2 and μ3 are the mean times taken for downloading with
Azureus, utorrent and Bittorrent
Hypothesis statement 3
time
time
The above statement is mathematically expressed as:
Ho: μ1 = μ2 = μ3
H1: at least any one μ is different
μ1, μ2 and μ3 are the mean times taken for downloading from
1-4 seeds, 5-8 seeds, 9-12 seeds
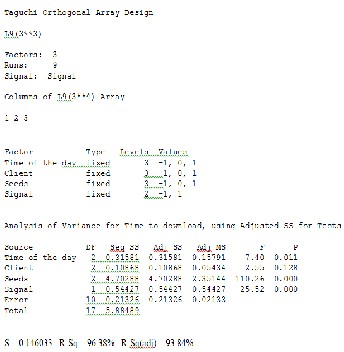
In order to conduct the experiment, the design was developed using Minitab. three factors, namely, ‘Time of the day’ with 3 levels, ‘Client’ with 3 levels and ‘Seeds‘ with 3 levels were put into a Taguchi design module in Minitab. Since there are 3 factors with 3 levels and one replication and a signal, the data capture form is for L9 design and since we have a signal the total will be 18 experimental runs as shown in Table1.
The experiment was conducted with 6 laptops each laptop has
3 clients. The time taken for downloading the file was record-
ed by using a stopwatch. The experiment was conducted in the early morning, afternoon and evening. The speed availa- ble by the internet provider is 4Mb and the file size is fixed
10.33Mb. The randomized Run Order is as shown.
Table 1 Data Capture form
Table 2 shows the ANOVA table for the selected 18 factorial experiment. There is no three-factor or higher order interac- tion effects. Therefore, we feel confident to say that only factor
‘Seeds’ and 'Time of the day' is important in this experiment. The model’s F-statistic for Seeds is 110.26 and significant 7.40 for time of the day.
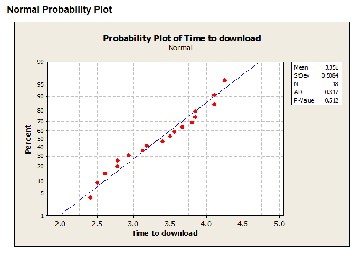
Furthermore, observation of the main effects plots of the three factors indicates that largest effect is for the factor ‘Seeds’ (Appendix). The normal probability plot of the response vari- able easily passed the “fat-pencil test” and indicates that the values are following normal distribution.
All the factors have positive effect; however, factor ‘Seeds’, has a much higher effect than the other factors ‘Client' and ‘Time of Day’. The three-dimensional surface and contour plots also show that the direction for further optimization experiment will be in that of steepest decent of the surface slopes or the direction of the smallest values of the contour plot (Appen- dix). This is because the smaller the response values, the lower the time taken for downloading.
The model equation for this experiment is shown below: Y = 0 + 1X1 + 3X3 +
In terms of actual factors:
Time to download in minutes = 3.18 + 0.069 Time of the day -
0.021 Client - 0.418 Seeds + 0.348 Signal
This model equation can be used to predict design points. This test is often necessary in order to see how well the model equation can correctly describe the experiment. Seeds have a larger effect compared to other factors. Interaction effect is eliminated due to its insignificance (Appendix).
After studying the normal plots and factor plots we proceeded with the analysis if variance. The insignificant terms were taken out of the model and the ANOVA table was obtained from Minitab package. The ANOVA table is shown in Table 2.
From this table, we found the P-Values of the effects of the factors “Seeds” to be 0.000 and “Client” 0.128 and “Time of Day’ to be 0.011. This proved that ‘Seeds’ and 'Time of the day' has a significant effect since the p-Value < 0.05. On the other hand the other factor has p-Values ≥ 0.05 which shows that they are insignificant. Also, the P-value of the model can also
IJSER © 2014
23
International Journal of Scientific & Engineering Research Volume 5, Issue 5, May-2014
ISSN 2229-5518
be found. Hence, we reject the null hypothesis and conclude that at there is at least one factor that is affecting the time of downloading. There is only a 0.01% chance that a “Model F- Value” this large could occur due to noise. The “Predicted R- Squared” value of 0.9638 is in reasonable agreement with the “Adjusted R Squared” value of 0.9384. All these values are shown in Table 2.
The factors, their levels and values along with the ANOVA
table are shown in Table 2 below.
Table 2: Analysis of Variance
After the analysis of variance, we studied the regression mod- el that as obtained from “Minitab” package. The regression model equations were found to be as given below:
Final Equation in Terms of Coded Factors:
From the regression equations, we can predict the amount of time that the file would take to download during the day. We see that the coefficients of time of the day factors and the sig- nal in the equation are positive. So, this leads us to believe that higher levels of factors would result in increasing the downloading time. Similarly the higher levels of the factors seeds and client would result in reducing the downloading time.
The final regression equation is obtained as:
Predictor Coef SE Coef T P Constant 3.1767 0.1648 19.27 0.000
Time of the day 0.0692 0.1427 0.48 0.636
Client -0.0208 0.1427 -0.15 0.886
Seeds -0.4183 0.1427 -2.93 0.012
Signal 0.3478 0.2331 1.49 0.160
S = 0.494428 R-Sq = 46.0% R-Sq(adj) = 29.4%
The normal graph was plotted and analyzed for finding out the significant factors. After analyzing the normal graph, we found that the effects “Seeds” and “Time of Day” were the effects that were significantly away from the straight line. So, we concluded that these factors were not distributed with a mean zero and a constant variance. So, these two effects were the only two effects that were significant. The Normal Graph is shown in the Appendix.
After the Analysis of variance and the Regression model, we analyzed the residual plots.
The Normal plot of the residuals was plotted and the plot showed that almost the residuals would pass the fat pencil test, which proved that the residuals were normally distribut- ed. The plot is shown in Appendix.
The contour plots and 3d-Surface plots are not straight which shows that interaction is significant. The contour plot of seeds and client show slight curvature indicating an interaction. All other plots are also indicate interaction.
The Bartlett’s test is a test for equal variances. It checks if the variances of the factor level means are significantly different or not. The Bartlett’s test statistic was computed by Minitab as
4.47 and the p-Value is 0.812. This shows that there is no sig- nificant difference in variances between the means.
From the Analysis of Variance table, we found that the value of the F-Statistic to be 110.26 and its P-Value to be 0.0001. The large model F-Value of 110.26 and its small P-Value of 0.00001 implies that the model is significant. There is only a 0.01 % chance that the model F-Value so large could have occurred due to noise.
The “Predicted R-Squared” value of 0.9638 is in reasonable agreement with the “Adjusted R Squared” value of 0.9384. From the analysis of the “Normal Graph”, we found that the factors “Seeds” and “Time of the day” were significant. This was further supported by the fact that the P-Values of ‘Seeds’ and 'time of the day' is far less than 0.05.
IJSER © 2014
24
International Journal of Scientific & Engineering Research Volume 5, Issue 5, May-2014
ISSN 2229-5518
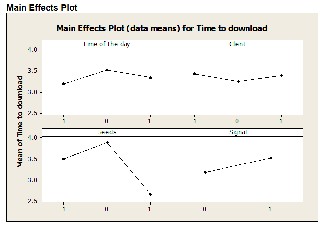
From the Model Graphs plotted in “Minitab”, we plotted the graphs of the Response Variable Vs Significant factors. When the graph of the “Time taken Vs seeds” was plotted, we found that the graph was linear and that the time taken to download increased when the seed number increased.
Similarly, we plotted the “Time taken Vs Client” was plotted we found that the graph was linear and that the time taken to download the file didn't increase we try different client.
We found from a closer look at the data that the file took lesser time to download when the significant 'seed' factors were at their higher levels and the 'Time of Day' at lower level. We proceeded to analyze the regression model to verify this. In the regression model, the coefficients of the significant factors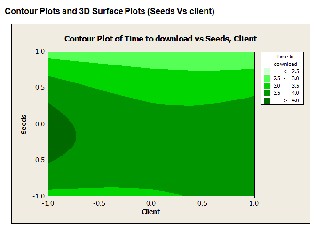
'seeds' are negative and Time of the day is positive. Hence, in
order to reduce the response variable (i.e. time), we have to keep the factor seed at its higher level and Time of day at low- er level. The significant factors in their best levels are “4-5 seeds” and “morning”. Thus, the regression model also sup- ports our conclusions.
After analyzing the collected data and summarizing the con- clusions, we recommend the following suggestions to improve the time of downloading so that we can download files faster. Our recommendations can be summarized as follows:
Pick the file with the highest number of seeds.
Download in the morning.
Turn off all the uploading files in the client software.
We recommend Utorrent and morning download with as
much seeds as possible to achieve higher download speed.
IJSER © 2014