design is a spherical design with all points lying on a sphere of radius 2 . Also the Box – Behnken design does not contain any point at the vertices of the cubic region created by the upper and lower limits for each variable.
International Journal of Scientific & Engineering Research, Volume 4, Issue 4, April-2013 620
ISSN 2229-5518
1 Scientist/Engineer, Vikram Sarabhai Space Centre (ISRO) Trivandrum, India
2 Assistant Professor, Viswajyothi College of Engg. and Technology, Muvattupuzha, India
3 Professor, National Institute of Technology, Tiruchirappalli, India
Corresponding author: manohar_isro@yahoo.com
This paper discusses the use of Box Behnken design approach to plan the experiments for turning Inconel 718 alloy with an overall objective of optimizing the process to yield higher metal removal, better surface quality and lower cutting forces. Response Surface methodology (RSM) has been adopted to express the output parameters (responses) that are decided by the input process parameters. RSM also quantifies the relationship between the variable input parameters and the corresponding output parameters. RSM designs allow us to estimate interaction and even the quadratic effects, and hence, give us an idea of the shape of the response surface we are investigating. Box-Behnken design is having the maximum efficiency for an experiment involving three factors and three levels; further, the number of experiments conducted for this is much lesser compared to a central composite design. The proposed Box-Behnken design requires 15 runs of experiment for data acquisition and modeling the response surface. Design expert software was used to design the experiment and randomize the runs. Regression model was developed and its adequacy was verified to predict the output values at nearly all conditions.
Further the model was validated by performing experiments, taking three sets of random
IJSER © 2013
International Journal of Scientific & Engineering Research, Volume 4, Issue 4, April-2013 621
ISSN 2229-5518
input values. The output parameters measured through experiments (actual) are in good match with the predicted values using the model. Using ‘Design-expert’ software, 2D and
3D plots were generated for the RSM evolved. Such plots explicitely give an idea of the dominating process variable over others and the order of dominance; further the plots exhibit the trend of variables’ interaction in the process.
This work resulted in identifying the optimised set of turning parameters for Inconel
718 material using coated carbide tools, to achieve better surface roughness and higher material removal. This work gains significance in the sense with minimum number of experiments, reliable model has been generated, validated and further, the process has been optimised with two objectives.
Key words: optimization, Inconel 718, Box-behnken, RSM, coated carbide tools
While machining a component, achieving fine surface finish is essential to provide suitable condition for its long life due to wear resistance, fatigue resistance, functional interchangeability and maximum service-efficiency, at minimum cost. Surface finish generated on a work-piece in a machining operation has been considered as the sum of two independent effects: the ‘ideal’ surface roughness and the ‘natural’ roughness. The ideal surface roughness is the result of the geometry of the tool and the feed and natural roughness is caused by the irregularities in the machining operation. Ideal surface roughness is the best surface finish that can be obtained with a given tool-shape and feed-rate and can be achieved if the effect of natural surface finish is eliminated [1]. Many researchers have concurred that, it is a characteristic that could influence the performance of the mechanical parts and the production costs. Better surface finish is possible by controlling the input
parameters involved in machining [2]. In other words, measuring and characterizing the
IJSER © 2013
International Journal of Scientific & Engineering Research, Volume 4, Issue 4, April-2013 622
ISSN 2229-5518
roughness of machined surface is considered for evaluating the process performance [3], [4].
Aerospace materials such as nickel-based alloys show poor machinability owing to their excellent physical properties which include high strength and high hardness at elevated temperatures, high dynamic shear strengths, high work hardening, and low thermal diffusivity [5] [6]. These characteristics cause cutting temperature and resultant tool damage to increase even at low cutting speeds and low feed rates [6][7]. For machining these
‘difficult-to-machine’ materials, development of new technologies in the area of cutting tools has given a great relief to the researchers, in terms of achieving higher metal removal, better machined-surface quality and longer tool-life[8]. Under the advent of latest cutting tools, efforts have been made to conduct machining experiments and optimize the parameters to achieve simultaneously higher productivity and better surface-quality.
Taguchi methods are widely used in research studies for experimental design to efficiently optimize the manufacturing process [9, 10]. It is an iterative experimental approach focused precisely on finding the role of individual process parameters and also the effect of their interaction with each other in bringing out the responses. Taguchi design of experiments (DOE) methods incorporate orthogonal arrays to minimize the number of experiments required to determine the effect of process parameters upon the responses of the process.
In this study the optimization approach provided by the Box–Behnken design (BBD), which is a response surface methodology (RSM) is proposed [11]. For applying the approach, Design-Expert software (Version 7.0.0, Stat-Ease Inc., Minneapolis, USA), was used. On the basis of the BBD, the process parameters (cutting speed, feed-rate and depth of
cut) in the turning process could be optimized with a minimum number of experimental
IJSER © 2013
International Journal of Scientific & Engineering Research, Volume 4, Issue 4, April-2013 623
ISSN 2229-5518
runs with an objective of achieving higher material removal, better machined-surface quality resulting in overall cost-advantage. As a collection of statistical and mathematical techniques for developing, improving, and optimizing processes, RSM is specifically applied in situations where several input variables potentially influence a performance measure or quality characteristic of the product or process [12] [13] [14].
Objective of this work is to develop a model for the prediction of surface roughness, cutting forces while turning Inconel 718 alloy using coated carbide tools, based on the experimental data; further the model was validated with different set of experimental values and surface plots were generated to explain the trend of achievable surface-roughness, under specific combination of process parameters. Ultimately this is useful in understanding the influence of process parameters and the resulting output parameters; further enables in determining the optimum set of machining parameters in terms of surface roughness and material removal, for turning Inconel 718 alloy using coated carbide cutting tools.
2.0 Experiment Details
Work material: Inconel 718 cylindrical work piece of 60 mm diameter in the annealed condition.
Cutting Tool used: Tool Inserts used for the experiments are of fine-grained tungsten carbide 6% Cobalt substrate with a CVD Multilayer coating. The coating layers are TiN/TiCN/Al2O3 with a total thickness of 12µm. Herein after this cutting tool is referred as
‘Cutting Tool – A’.
All the turning experiments were conducted in a CNC turning centre. Work-piece was machined for a width of 12 mm (appears like a ring), for each set of machining parameters and 15 such rings were machined and identified in the same order. Machining
was carried out with each set of parameters once and the cutting-forces’ and surface
IJSER © 2013
International Journal of Scientific & Engineering Research, Volume 4, Issue 4, April-2013 624
ISSN 2229-5518
roughness values were measured as output for each experiment. Actual values of the input
Vs output parameters of the experiment are listed in Table - 3.
3.0 Methodology
It can be seen from the literatures [12] [13] [14] [15] that developments and current practices in the area of process improvement recommend employing RSM for expressing the output parameters (responses), in terms of input variables.
RSM is a collection of statistical and mathematical methods that are useful for the modeling and analyzing engineering problems. In this technique, the main objective is to optimize the response surface that is influenced by various process parameters [16] [17] [18]. RSM also quantifies the relationship between the controllable input parameters and the obtained response surfaces. The design procedure of RSM is as follows
(i) Designing of a series of experiments for adequate and reliable measurement of the response of interest.
(ii) Developing a mathematical model of the second order response surface with the best fittings.
(iii)Finding the optimal set of experimental parameters that produce a maximum or minimum value of response.
(iv) Representing the direct and interactive effects of process parameters through two and three dimensional plots.
RSM designs allow us to estimate interaction and even quadratic effects, and therefore give us an idea of the (local) shape of the response surface under investigation.
Box-Behnken designs and central composite designs are efficient designs for fitting second
IJSER © 2013
International Journal of Scientific & Engineering Research, Volume 4, Issue 4, April-2013 625
ISSN 2229-5518
order polynomials to response surfaces, because they use relatively small number of observations to estimate the parameters. Rotatability is a reasonable basis for the selection of a response surface design. The purpose of RSM is optimization and the location of optimum is unknown prior to running the experiment, it makes sense to use a design that provides equal precision of estimation in all directions. For such purposes, Central Composite Design (CCD) - spherical or face centered and Box – Behnken design are the commonly used experimental design models for three level three factor experiments.
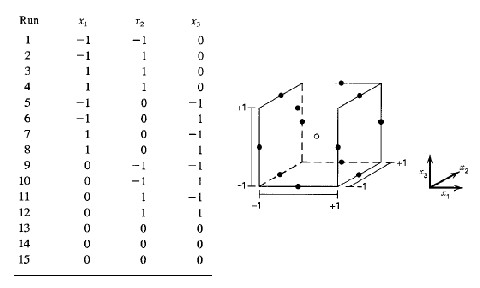
Box and Behnken proposed three level designs for fitting response surfaces. These designs are formed by combining 2k factorials with incomplete block designs. Figure-1 illustrates the three variable Box – Behnken design. It can be noticed that the Box-Behnken![]()
design is a spherical design with all points lying on a sphere of radius 2 . Also the Box – Behnken design does not contain any point at the vertices of the cubic region created by the upper and lower limits for each variable.
IJSER © 2013
International Journal of Scientific & Engineering Research, Volume 4, Issue 4, April-2013 626
ISSN 2229-5518
This could be advantageous when the points on the corners of the cube represent factor level combinations that are impossible to test due to physical process constraints or prohibitivel y expensive. Its "missing corners" may be useful when the researcher should avoid combined factor extremes. This property prevents a potential loss of data in those cases.
Box-Behnken designs require fewer treatment combinations than a CCD, in problems involving 3 or 4 factors. The Box-Behnken design is rotatable (or nearly so) but it contains regions of poor prediction quality like the CCD.
In this study, the experiments were planned and conducted according to a Box- Behnken type response surface design.
The second order response surface representing the surface roughness can be expressed as a function of cutting speed, feed and depth of cut, being the input variables of machining (turning) process [19] [20] [21]. A regression model can also be employed for this purpose [22, 23].
Analysis of variance, ANOVA, is a statistical decision making tool used for detecting any differences in average performances of tested parameters [9]. It employs sum of squares and F statistics to find out relative importance of the analyzed processing parameters, measurement errors and uncontrolled parameters.
Analysis of variance (ANOVA) was used to check the adequacy of the model for the responses in the experimentation.
IJSER © 2013
International Journal of Scientific & Engineering Research, Volume 4, Issue 4, April-2013 627
ISSN 2229-5518
Process parameters for the study had three levels as given in Table 1. The levels were fixed based on the preliminary experiment-trials, discussion with cutting tool manufacturers and also the available literatures.
Cutting speed (m/min) | Feed (mm/rev) | Depth of cut (mm) | |
Level 1 | 40 | 0.20 | 1.0 |
Level 2 | 50 | 0.25 | 1.5 |
Level 3 | 60 | 0.30 | 2.0 |
RSM designs allow us to estimate interaction and even quadratic effects, and hence give us the idea of the (local) shape of the response surface under investigation. Box- Behnken design is having the maximum efficiency for an RSM problem involving three factors and three levels. Also the number of runs required is less compared to a central composite design.
The proposed Box-Behnken design requires 15 runs for modeling a response surface. The process parameters for the experimental runs are selected based on the standard design shown in Figure 1. Details of the experimental runs with the set of input parameters that were conducted are given in Table 2. Design expert software was used to design the experiment and randomize the runs. Randomization ensures that the conditions in one run neither depend on the conditions of the previous runs nor predict the conditions in the subsequent runs. Randomization is essential for drawing conclusions from the experiment,
in correct, unambiguous and defensible manner.
IJSER © 2013
International Journal of Scientific & Engineering Research, Volume 4, Issue 4, April-2013 628
ISSN 2229-5518
Most importantly, parameters corresponding to the central point (0,0,0) are repeated twice to establish that the experimental data is within the normal dispersion and repeatability is ensured.
Run order | Cutting speed (m/min) | feed (mm/rev) | depth of cut (mm) |
1 | 50 | 0.2 | 2 |
2 | 40 | 0.2 | 1.5 |
3 | 60 | 0.25 | 2 |
4 | 40 | 0.3 | 1.5 |
5 | 50 | 0.25 | 1.5 |
6 | 60 | 0.3 | 1.5 |
7 | 50 | 0.3 | 1 |
8 | 50 | 0.2 | 1 |
9 | 50 | 0.3 | 2 |
10 | 60 | 0.25 | 1 |
11 | 40 | 0.25 | 2 |
12 | 60 | 0.2 | 1.5 |
13 | 40 | 0.25 | 1 |
14 | 50 | 0.25 | 1.5 |
15 | 50 | 0.25 | 1.5 |
Runs 14 and 15 are repeat of run -5
Turning experiments were conducted on Inconel 718 in the annealed condition with Cutting tool –A, for the set of input parameters under the 15 conditions given by Box – Behnken design. Cutting forces were measured during the turning operation and the Surface roughness of the machined surfaces was measured and the values were recorded.
The cutting forces and surface roughness values measured as output parameters (responses)
IJSER © 2013
International Journal of Scientific & Engineering Research, Volume 4, Issue 4, April-2013 629
ISSN 2229-5518
for the 15 runs are given in Table 3.
Run | Cutting speed (m/min.) | Feed (mm / rev.) | Depth of cut (mm) | Ra (μm) | Fx (N) | Fy (N) | Fz (N) | MRR (cm3 / min) |
1 | 50 | 0.2 | 2.0 | 3.13 | 180 | 48 | 68 | 4900 |
2 | 40 | 0.2 | 1.5 | 3.15 | 178 | 45 | 70 | 2352 |
3 | 60 | 0.25 | 2.0 | 3.28 | 185 | 49 | 67 | 8820 |
4 | 40 | 0.3 | 1.5 | 3.71 | 222 | 71 | 89 | 3528 |
5 | 50 | 0.25 | 1.5 | 3.25 | 182 | 48 | 69 | 4594 |
6 | 60 | 0.3 | 1.5 | 3.60 | 199 | 57 | 71 | 7938 |
7 | 50 | 0.3 | 1.0 | 3.56 | 204 | 60 | 79 | 3675 |
8 | 50 | 0.2 | 1.0 | 2.98 | 160 | 36 | 59 | 2450 |
9 | 50 | 0.3 | 2.0 | 3.75 | 220 | 75 | 91 | 7350 |
10 | 60 | 0.25 | 1.0 | 3.15 | 170 | 40 | 58 | 4410 |
11 | 40 | 0.25 | 2.0 | 3.42 | 201 | 58 | 80 | 3920 |
12 | 50 | 0.25 | 1.5 | 3.24 | 182 | 48 | 68 | 4594 |
13 | 50 | 0.25 | 1.5 | 3.23 | 180 | 48 | 67 | 4594 |
14 | 60 | 0.2 | 1.5 | 3.01 | 160 | 39 | 60 | 5292 |
15 | 40 | 0.25 | 1.0 | 3.24 | 179 | 47 | 69 | 1960 |
Response surface methodology (RSM) involves mathematical and statistical techniques that are used for modeling and analyzing the problems in which a process- response is influenced by several input variables and the research-objective is to optimize this response. For adopting RSM, selection of contributing parameters, their levels and proper experimental design are essential. RSM consists of a group of techniques used in establishing empirical study of the relationship between a response and several input variables. The main advantage of using RSM is to understand and evaluate the effect of
multiple parameters and their interactions with each other in bringing out the response(s).
IJSER © 2013
International Journal of Scientific & Engineering Research, Volume 4, Issue 4, April-2013 630
ISSN 2229-5518
Hence, it is considered as an appropriate approach to optimize a process with one or more responses [13] [16].
The relationship between the factors and the performance measures are expressed by multiple regression equations, which can be used to estimate the expected values of the performance level for any factor levels [19] [20] [21].
If all variables are assumed to be measurable, the response surface can be expressed as y=f (x1, x2, ….., xk). The goal is to optimize the response variable y. It is assumed that the independent variables are continuous and controllable by experiments with negligible errors. Usually a second-order model is utilized to find a suitable approximation for the
functional relationship between independent variables and the response surface.
y β0
k
i1
βi x i
k
i1
βii x i
βij x i x j ε
i j
(1)
where ε is a random error.
In matrix form,
Y = X + (2)
The solution of Eq. (2) can be obtained by the matrix approach.
= (XTX)-1XTY (3)
The details of the solution by this matrix approach are explained in [10].
Second order RSM representing the relationship between each of the ouput parameters viz. surface roughness, Cutting forces and MRR and the input process parameters, viz. cutting speed, feed rate and depth of cut was generated using the values of the experimental data and given below.
Ra = 4.97 - .0235 v -15.475 f + 0.128 d + 0.015 vf - 2.5E-003 vd + 0.4 fd + 1.75E-004 v2 +
40.0 f2 + 0.02 d2 (4)
IJSER © 2013
International Journal of Scientific & Engineering Research, Volume 4, Issue 4, April-2013 631
ISSN 2229-5518
Fx = 226.25 + 0.075 v - 897.5 f + 27.75 d - 2.50 vf - 0.35 vd - 40.0 fd + 2.5 E-003 v2 +
3000.0 f2 + 6.0 d2 (5) Fy = 82.38 + 1.325 v -732.5 f - 4.25 d - 4.0 vf - 0.1 vd +30.0 fd - 6.25 E-003 v2 +
2250.0 f2 + 4.5 d2 (6) Fz = 87.38 + 1.625 v - 587.5 f + 0.25 d - 4.0 vf - 0.1 vd + 30.0 fd - 0.011 v2 +
1850.0 f2 + 2.5 d2 (7) MRR = 18750.0 - 375.0 v - 75000.0 f -12500.0 d +1500.0 vf +
250.0 vd + 50000.0 fd (8)
The analysis of variance (ANOVA) technique was used to check the adequacy of the developed models at 95% confidence level [24] [25] [26]. The criteria followed in this technique is that if the calculated value of the F-ratio of the regression model is more than the standard value specified (F-table) for 95% confidence level, and then the model is considered adequate within the confidence limit [27][28][29]. From Table - 4, it is observed that all the models satisfy the adequacy conditions in non-linear form.
ANOVA results for the response surface quadratic models are given in Table- 4. The results were obtained using Design Expert software.
Ra | Fx | Fy | Fz | |
R-Squared | 0.9977 | 0.9973 | 0.9884 | 0.9842 |
Adjusted R-Squared | 0.9936 | 0.9924 | 0.9675 | 0.9558 |
Predicted R-Squared | 0.9647 | 0.9586 | 0.8142 | 0.7543 |
Adequate Precision | 46.756 | 44.482 | 20.890 | 19.048 |
IJSER © 2013
International Journal of Scientific & Engineering Research, Volume 4, Issue 4, April-2013 632
ISSN 2229-5518
In all the responses, ‘Predicted R-squared’ values are in reasonable agreement with the ‘Adjusted R-Squared’ values. ‘Adequate Precision’ indicates the signal to noise (S-N) ratio. Normally the ratio greater than 4 is desirable, for the model to be used effectively; obtained-ratios indicate adequacy for this model to be used to navigate the design space.
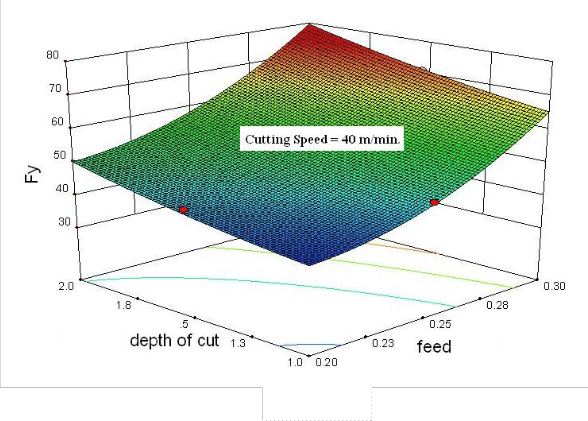
2-D and 3-D plots can be drawn for different combination of parameters which exhibit the the trend of variation of response within the selected range of input parameters and also influence of each parameter over the other parameters. Few such typical plots are shown (Figure 2 to 5). The pattern of the contour plots is almost alike when the feed and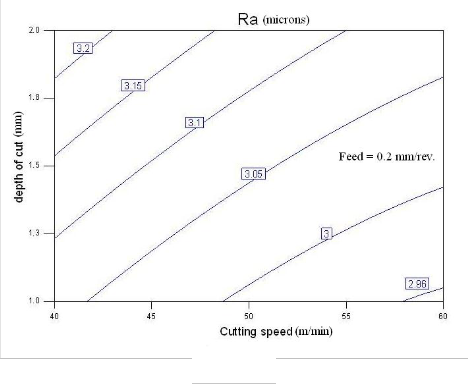
depth of cut are kept constant and when the cutting speed is kept constant, pattern of the
IJSER © 2013
International Journal of Scientific & Engineering Research, Volume 4, Issue 4, April-2013 633
ISSN 2229-5518
contour lines is showing the reverse trend. It is observed that the region showing optimum conditions for achieving surface roughness is almost same in all the three cases (when v, f and d are kept constant) and are in agreement with each other. As the feed and the depth of cut are approaching minimum, the cutting forces generated are minimum and the obtained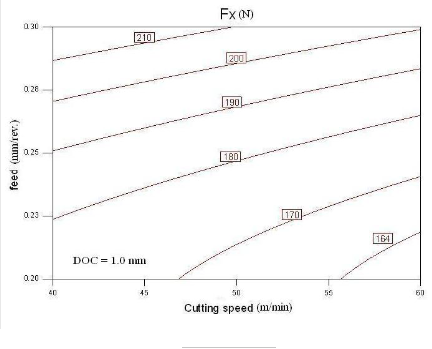
surface roughness is better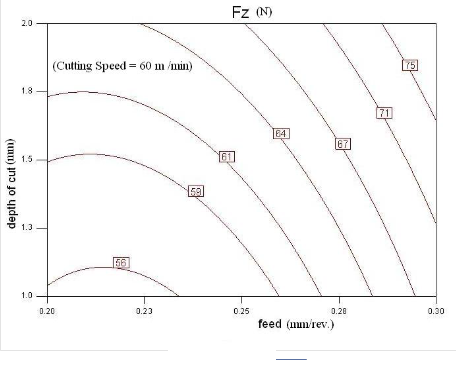
.ijser.org
International Journal of Scientific & Engineering Research, Volume 4, Issue 4, April-2013 634
ISSN 2229-5518
In addition to verification through ANOVA technique, the Models were validated by conducting experiments with new set of parameters and the multiple response values were measured and compared with the predicted values using the Models [30] [31]. Details of the experiments conducted, predicted and measured values of the output variables are given in Table- 5.
Parameters | Ra | Fx | Fy | Fz | ||||||
v | f | d | (P) | (M) | (P) | (M) | (P) | (M) | (P) | (M) |
40 | 0.3 | 2 | 3.82 | 3.76 | 232 | 231 | 80 | 78 | 97 | 95 |
50 | 0.2 | 1.5 | 3.06 | 3.09 | 169 | 171 | 42 | 42 | 65 | 64 |
60 | 0.25 | 1.5 | 3.21 | 3.2 | 174 | 177 | 43 | 44 | 61 | 63 |
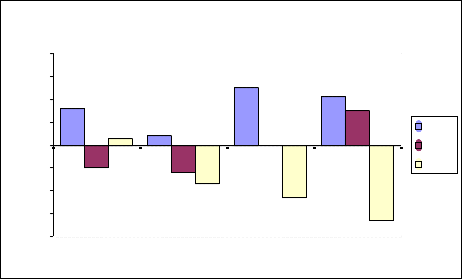
Deviation of the predicted values from the experimental values has been worked out to get
IJSER © 2013
International Journal of Scientific & Engineering Research, Volume 4, Issue 4, April-2013 635
ISSN 2229-5518
the % error for the validation data. The same has been plotted and shown in Figure -6.
4
3
2
1
0
-1
Ra Fx Fy Fz
-2
Trial 1
Trial 2
Trial 3
-3
-4
Re s pons e s
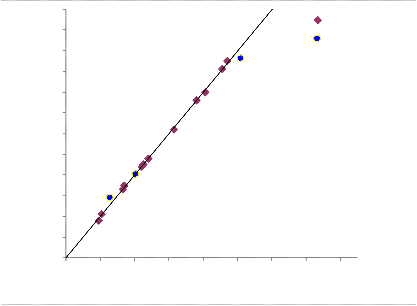
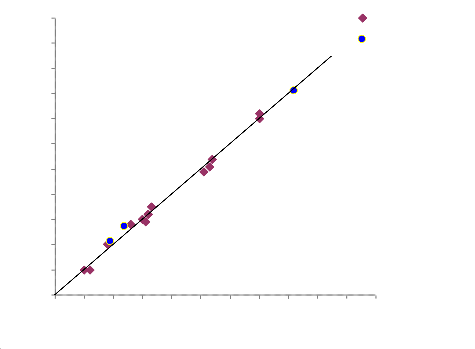
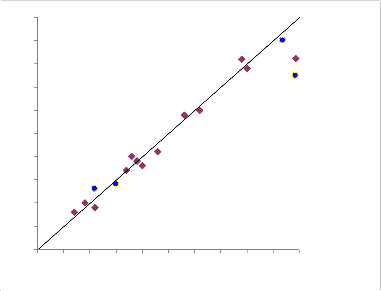
For easy understanding and clarity, graphical representation of predicted values using the Model together with the corresponding measured values of all the responses has
been made in Figures 7 – 10.
4
3.9
3.8
Model
Validation
3.7
3.6
3.5
3.4
3.3
3.2
3.1
3
2.9
2.8
2.8 3 3.2 3.4 3.6 3.8 4 4.2 4.4
Predicted Ra (microns)
IJSER © 2013
260
Model
Internation 636
ISSN 2229-
250
Validation
240
230
220
210
200
190
180
170
160
150
150 160 170 180 190 200 210 220 230 240 250 260
Predicted Fx (N)
90
86
82
78
74
70
66
62
58
54
50
46
42
38
34
30
30 34 38 42 46 50 54 58 62 66 70 74 78 82 86 90
Predicted Fy (N)
Model
Validation

IJSER © 2013
International Journal of Scientific & Engineering Research, Volume 4, Issue 4, April-2013 637
ISSN 2229-5518
100
95
90 Model
Validation
85
80
75
70
65
60
55
50
50 55 60 65 70 75 80 85 90 95 100
Predicted Fz (N)
![]()
In the figures (7 -10), Ideal line is plotted taking the predicted value same as the measured value and is considered as a reference line. Measured values of each response are plotted and their closeness to the Ideal line depicts the accuracy (fitness) of the model. The model developed for each response is considered accurate, where all the measured-values are aligning or closer with the Ideal line. In most of the cases, predicted and the experimental values follow close match and the extent of deviation is marginal.
Multi-objective optimisation was aimed at to achieve better quality coupled with higher
Response | Goal |
Ra | Minimise |
Fx | Minimise |
Fy | Minimise |
Fz | Minimise |
MRR | Maximise |
![]()
IJSER © 2013
International Journal of Scientific & Engineering Research, Volume 4, Issue 4, April-2013 638
ISSN 2229-5518
productivity. Accordingly optimisation criteria for each response were selected as given in
Table – 6.
Best Solution satisfying the above criteria was obtained using the ‘Design Expert’ software,
which is given below and it has the overall desirability of 0.82.
Cutting speed (m/min) | Feed (mm/rev) | depth of cut (mm) | Ra (µm) | Fx (N) | Fy (N) | Fz (N) | MRR (cm3/min) | Desirability |
60 | 0.21 | 1.7 | 3.06 | 166.64 | 40.53 | 60.19 | 6297.48 | 0.82 |
Contour plot given in Figure - 11, shows the variation of Desirability with change in cutting speed and feed when DOC is kept constant at optimum level of 1.7mm.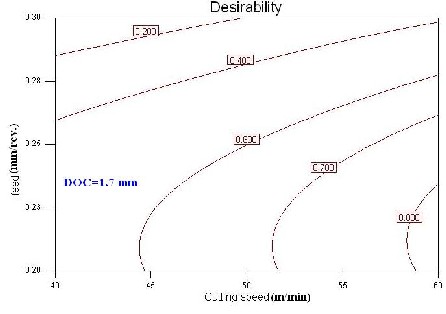
Box Behnken design was successfully adopted and the experiments were designed choosing the input variables for the levels selected. With minimum number of experiments,
IJSER © 2013
International Journal of Scientific & Engineering Research, Volume 4, Issue 4, April-2013 639
ISSN 2229-5518
data was collected and the models were developed. Response Surface Models evolved for responses show the effect of each input parameter and its interaction with other parameters, depicting the trend of response. Verification of the Fitness of each model using ANOVA technique, shows that all the models can be used with confidence level of 0.95, for navigating the design space. Further validation of the models done with the additional experimental data collected demonstrates that the models have high reliability for adoption within the chosen range of parameters.
Set of optimised input parameters could be identified taking into consideration of surface roughness, cutting forces and material removal, for turning Inconel 718 with coated carbide tools. Surface plots generated show the trend of different responses by varying the 2 input parameters keeping the 3rd parameter constant. With reduced number of experimental runs, fairly convincing, logical and acceptable results have been obtained, which can be followed for getting solution to the shop-floor requirements. This has resulted in saving of considerable amount of time and money.
Reference
1. G.Boothroyd, Fundamentals of Metal Machining, Arnold, Paris (1986)
2. Ezugwu E.O ,Tang S.H, Surface abuse when machining cast iron (G-17) and nickel- base superalloy (Inconel 718) with ceramic tools, Journal of Materials Processing Technology 55,(1995) 63-69.
3. Hamdi Aouici, Mohamed Athmane Yallese, Kamel Chaoui , Tarek Mabrouki, Jean- Francois Rigal, Analysis of surface roughness and cutting force components in hard turning with CBN tool: Prediction model and cutting conditions optimization, Measurement 45 (2012) 344–353
4. S.M. Darwish, Machining of difficult-to-cut materials with bonded tools, International
Journal of Adhesion & Adhesives 20 (2000) 279-289
IJSER © 2013
International Journal of Scientific & Engineering Research, Volume 4, Issue 4, April-2013 640
ISSN 2229-5518
5. R.M. Arunachalam, M.A. Mannan , A.C. Spowage , Residual stress and surface roughness when facing age hardened Inconel 718 with CBN and ceramic cutting tools, International Journal of Machine Tools & Manufacture 44 (2004) 879–887
6. Alauddin M, El-Baradie M.A and Hashmi M.S. J, Optimisation of surface finish in End-milling Inconel 718, Journal of Materials Processing Technology, 56, 54-65, (1996).
7. Feng Jiang & Jianfeng Li & Lan Yan & Jie Sun & Song Zhang, Optimizing end-milling parameters for surface roughness under different cooling/lubrication conditions, Int Journal of Advanced Manufacturing Technology 51(2010),841–851.
8. Sahin.Y, Motorcu. A.R. Surface roughness model in machining hardened steel with cubic boron nitride cutting tool, International journal of Refractory Metals & Hard Materials 26, 84-90, (2008).
9. Ross PJ, Taguchi techniques for quality engineering, McGraw- Hill, New York, (1996).
10. Montgomery D.C, Design and Analysis of Experiments, John Wiley and sons, New
York, (1991).
11. Taraman.K, Multi machining output - Multi independent variable turning research by response surface methodology, International Journal of Production Research, 13(4),
265-290, (1975).
12. V. N. Gaitonde & S. R. Karnik & B. Siddeswarappa, B. T. Achyutha, Integrating Box- Behnken design with genetic algorithm to determine the optimal parametric
combination for minimizing burr size in drilling of AISI 316L stainless steel, Int Journal of Advanced Manufacturing Technology 37(2008),230–240.
13. V. Suresh Babu, S. Sriram Kumar, R. V. Murali and M. Madhava Rao, Investigation and validation of optimal cutting parameters for least surface roughness in EN24 with response surface method, International Journal of Engineering, Science and Technology
Vol. 3, No. 6, 2011, pp. 146-160
14. Long Wu, Kit-lun Yick, Sun-pui Ng, Joanne Yip, Application of the Box–Behnken design to the optimization of process parameters in foam cup molding, Expert Systems
with Applications, Volume 39, Issue 9, (July 2012) 7585-8504.
IJSER © 2013
International Journal of Scientific & Engineering Research, Volume 4, Issue 4, April-2013 641
ISSN 2229-5518
15. Bahaedin Nikrooz , Morteza Zandrahimi, Optimization of process variables and corrosion properties of a multi layer silica sol gel coating on AZ91D using the Box– Behnken design, Journal of Sol-Gel Science and Technology, 59 (2011), 640–649.
16. K. Kadirgama, K. A. Abou-El-Hosseirr, B. Mohammad and H. Habeeb, Statistical model to determine surface roughness when milling hastelloy C-22HS, Journal of Mechanical Science and Technology, 21(2007) 1651-1655.
17. K.A. Abou-El-Hossein, K. Kadirgamaa, M. Hamdib Journal of Materials Processing Technology 182 (2007) 241–247, K.Y. Benyounis, Prediction of cutting force in end-milling operation of modified AISI P20 tool steel, Journal of Materials Processing Technology 182 (2007) 241–247
18. Nam-Ky Nguyena, John J. Borkowskib, New 3-level response surface designs construc- ted from incomplete block designs, Journal of Statistical Planning and Inference 138 (2008) 294–305
19. Paulo Davim.J, Francisco Mata, Optimisation of surface roughness on turning fibre reinforced plastics (FRPs) with diamond cutting tools, International Journal of Advanced Manufacturing Technology 26 (2005), 319–323.
20. Paulo Davim J – Pedro Reis, Machinability study on composite (polyetheretherketone reinforced with 30% glass fibre –PEEK GF30) using polycrystalline diamond (PCD) and cemented carbide(K20) tools, International Journal of Advanced Manufacturing Technology 23, (2004) , 412–418 .
21. Palanikumar.K, Application of Taguchi and response surface methodologies for surface roughness in machining glass fiber reinforced plastics by PCD tooling, International Journal of Advanced Manufacturing Technology, 36, 19–27, (2008).
22. Ersan Aslan, Necip Camuscu, Burak Birgoren, Design optimization of cutting parameters when turning hardened AISI 4140 steel (63 HRC) with Al2O3 + TiCN mixed ceramic tool, Materials and Design 28, 1618 – 1622,(2007).
23. Draper N.R and Smith. H, Applied Regression Analysis, John Wiley and sons, New
York (1981)
24. A.Altin, M. Nalbant , A. Taskesen, The effects of cutting speed on tool wear and tool life when machining Inconel 718 with ceramic tools, Materials and Design 28
(2007) 2518–2522
IJSER © 2013
International Journal of Scientific & Engineering Research, Volume 4, Issue 4, April-2013 642
ISSN 2229-5518
25. L.Li, N.He, M.Wang, Z.G.Wang, High Speed Cutting of Inconel 718 with coated carbide and ceramic inserts, Journal of Materials Processing Technology 129 (2002)
127–130.
26. R.S. Pawade, Suhas S Joshia, P.K. Brahmankar, Effect of machining parameters and cutting edge geometry on surface integrity of high-speed turned Inconel 718, International Journal of Machine Tools & Manufacture 48 (2008) 15–28.
27. Y.S. Liao, R.H. Shiue, Carbide tool wear mechanism in turning of Inconel 718 superalloy, Wear 193 (1996) 16-24
28. M. Alauddin , M.A. Mazid , M.A. El Baradi , M.S.J. Hashmi, Cutting forces in the end milling of Inconel 718, Journal of Materials Processing Technology 77(1998)
153 - 159.
29. G. Akhyar, C.H. Che Haron, J.A. Ghani, Application of Taguchi Method in the Optimization of Turning Parameters for Surface Roughness, International Journal of Science Engineering and Technology Vol. 1, No. 3 (2008), 60-66.
30. Risbood KA, Dixit US, Sahasrabudhe AD, Prediction of surface roughness and dimensional deviation by measuring cutting forces and vibrations in turning process, J Material Processing Technology 132, 203 –214 (2003).
31. Feng CX. An experimental study of the impact of turning parameters on surface roughness. In: Proceedings of the 2001, Industrial Engineering Research Conference, Paper No. 2036.
******************
IJSER © 2013