International Journal of Scientific & Engineering Research, Volume 3, Issue 6, June 2012 1
ISSN 2229-5518
Hisham A. H. AL-KHAZALI and Mohamad R. ASKARI
Abstract — Analyzing rotating data requires a tachometer measurement to estimate the machine RPM as a function of time. The accuracy of the RPM versus time function is important for analyzing rotating data. Vibration measurements can be expressed in terms of displacement, velocity, acceleration, and high frequency content (for bearing condition detection). Most data collectors use FFT (Fast Fourier Transform) to convert the data from the time domain to the frequency domain. Vibration data collectors have a built-in PC interface that allows transfer of the measurements to a PC for data management. Analysis software displays spectrum, trend, waterfall plots, and waveform for advanced analysis. To assess a machine, the vibration data is compared with historical profiles from the same machine.
In this research an RPM spectral map plots frequency along the x axis, amplitude along the y axis, and shaft speed in revolutions per minute (RPM) along the z axis. View an RPM spectral map to determine, how vibration changes with machine
speed, and which components are related to rotational speed. The experimental technique used thus far is called Modal Testing;
the technique has recently been applied to rotating structures.
The objective of study, it is envisaged that the approach isn’t limited to the condition monitoring and predictive failure but could
help the designers to have better understanding of rotor performance at the system design stage.
Keywords- Analysis software, Modal testing, Rotating data, Spectral map, Tachometer.
—————————— ——————————
HE vibration analysis software is an essential tool for professionals who are analyzing the vibratory behavior of structures and machines[1], [2]. The SO Analyzer Rotate Solutions contain several wizards for analyzing your rotating data which can be accessed via the analysis menu.
Spline Fit a tachometer measurement to estimate the RPM as a function of time with the Tacho Spline Fit Wizard[3],[4].
• Create frequency versus amplitude versus time plots with
the RPM Spectral Map Wizard.
• Compute selected orders as a function of RPM with the
Computed Order Tracking Wizard[ 5], [6].
• Create an Orbit Plotting analysis using time history RPM
data (e.g. for bearing and shaft analysis). Before analysis can begin, Vibration must be converted to an electrical signal-a task performed by vibration transducers[7],[8], [9]. The key considerations in obtaining a signal that accurately represents the vibration are: (i) selecting the right type of transducer, and (ii) locating and installing it correctly. The vibration characteristics of a machine depend on its dynamics and the nature of the forces acting upon it[10], [11]. The change of these characteristics with machine speed has
two important implications for analysis: (i) the vibration resulting from a defect may not appear in all speed ranges, and (ii) insight into the nature of the machine may be obtained from observing the change in vibration with speed[12], [13]. The concept of phase relationships is most easily seen in the time domain. RPM spectral maps usually consist of a series of vibration spectra measured at different speeds. A variety of other parameters, including time, load, and temperature are also used as the third dimension for maps and waterfalls[3],[14]. A common method for mapping the variations in the vibration with RPM is to measure successive spectra while the machine is coasting down or running up in speed. If the machine is instrumented with a tachometer, the speed can be monitored and used to trigger the measurement thus obtaining vibration spectra at uniformly spaced RPM[2],[15]. Alternatively, use the SO analyzer configuration page and select the rotate and the postprocessing options. Structural resonances can cause increases in vibration level with RPM. Resonances are fixed in frequency and are straight lines in the map. Orders are multiples of the fundamental running speed of the machine. Order related components move across the map, to the right as RPM increases [5],[16], [17]. The RPM Spectral Map Wizard computes the frequency spectra for each RPM value by
IJSER © 2012
International Journal of Scientific & Engineering Research, Volume 3, Issue 6, June 2012 2
ISSN 2229-5518
1. Locating the time point of the given RPM value from the
RPM versus time spline fit[1].
2. Selecting the time samples around the determined RPM
time, and
3. Applying a window to the resulting measurement time
block and performing a Fourier transform[2], [18].
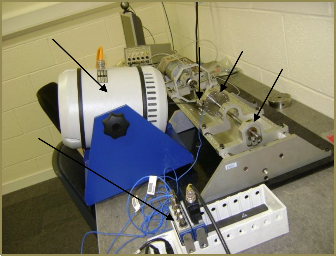
Shaker test or (an electromagnetic shaker), also known as an electro dynamic shaker (consist of a magnet, moving block and a coil in the magnet)[19], use to find the modes of vibration of a machine or structure. The test rotor is shown in picture (1). Basically, the rotor consisted of a shaft with a nominal diameter of 10 mm, with an overall length of 610 mm. Two plain bearings, RK4 Rotor kit made by Bentley Nevada (the advanced power systems energy services company), are used to extract the necessary information for diagnostic of rotating machinery, such as turbines and compressor[5],[8]. The testing of the process will be conducted on the rotary machine as the project is based on rotary dynamics reach practical results for the purpose of subsequently applied machinery rotary by using (smart office program), the smart office is the software which is used in this project [16]. It analyzer is suitable for accurate and efficient noise and vibration measurements, third-party data import/export, data analysis and reporting of the results. The SO analyzer supports a wide range of measurement front–end (USB, PCI, PX1 and VX1) which
enables the applications (from two to hundreds of input
channels)[5],[20], [21]. Then, do the experimental testing using the electromagnetic shaker test, installed two accelerometers (model 333B32, sensitivity 97.2 & 98.6 mV/g) in Y&Z direction, it was attached to the test structure with creating a computer when taking readings in file that was dimensions and introducing it with the data within the program (smart office) [21],[22], [23].
The Picture (1) shows the electromagnetic shaker body (type TIRA vibration, TIRA GmbH, S521, V 22, Nr 142/07). Load cell (type PCB, TOP BASE, SN 25580, 208 CO1). The acquisition system is connecting to the load cell. The other channels are set to ‘Response’ depending on the number of accelerometers available to use[18],[20]. All transducers have
‘Input Mode’ of ‘ICP’. In this channel the source signal is
activated and selected. Make sure that the module NI-9263 is connected to the IDAQ Chassis. This is an output module which generates signal. Connect a BNC cable from the NI-
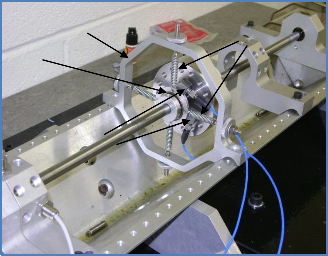
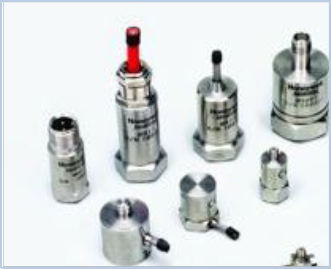
9263 module to the amplifier ‘input’ slot at the back of the amplifier. Select ‘Active’ in the ‘Usage’ column. Assign a name to the source. Select the signal from the ‘Mode’ column. Adjust the parameters according to the test requirements. Conceptual design the experiment to carry out vibration test (movement accelerometer)[15]. The accelerometer was attached to the test structure using either bees wax or a high-strength adhesive to coherent with outer surface for design and for the purpose of generating strength of the movement for the vibration body and the creation of vibration for that freely movement along the shaft picture (2), and picture (3) show Different types of accelerometers you can used, 2012.
Picture 1. Experimental setup for the modal testing. Picture 2. Designing movement frame coherent with accelerometers.
IJSER © 2012
International Journal of Scientific & Engineering Research, Volume 3, Issue 6, June 2012 3
ISSN 2229-5518
r G jk r R j
r Lk
and
r G jk r R j r Lk
(5)
Where ØR and ØL are mass-normalised mode shape/
Eigen vectors.
Bi-Orthogonality relationships of left and right Eigen vector could be used to diagonals the reacceptance matrix and cross reacceptance between two coordinate’s j and k may be obtained as follows [3],[4],[12],[ 26]:
n R L
R
L
H jk
![]()
![]()
r j r k
r j r k
r 1
i sr
i sr
(6)
Picture 3. Different types of accelerometers, 2012.
However the complex Eigen values have the following![]()
forms:
sr , sr r r ir
1 r 2
(7)
Substituting ‚(7) ‚ into ‚(6)‛ and simplifying give
2 Re G
1 2 Im G
i 2 Re G
The general equations of motion for a revolving and
n r r
r jk
![]()
r r
jk
r jk
H
supporting structure are given by [24], [25]:
jk
2 2 2i
M q(t) (C G) ()q(t) K ()q (t) F (t)
(1)
r 1
r r r
(8)
u(t ) q(t )
State space
Equation (8) represents the reacceptance between two
coordinates j and k for a system with n degree of freedom.
The denominator is identical to the denominator of the
q (t )
q(t) c1R1es1t c2 R2 es2t .......... ... c2n R2n es2 nt
2n
(a)
(2)
reacceptance expression for an n degree of freedom system with symmetric system matrices, but the numerator is very different.
q(t) cr Rr esr t
r 1
2n
q(t) dr Lr esr t
r 1
Vector space
(b) (3)
(c)
The SO Analyzer also offers a familiar way to carry out rotate measurements[27]. The Tacho Spline Fit Wizard was initially used in former smart office, but it is still available for certain applications.
( )
.
u(t )
![]()
q t
..
S q
st
e
State space (4)
The Tacho Spline Fit Wizard first estimates the machine
q(t )
![]()
S 2 q
RPM as a function of time by determining the time between
the Tacho pulses and computing the RPM[16],[28]. The raw
RPM estimate is not defined for every acquisition time point.
For simplification the following terms are introduced:
It fits a cubic spline to the raw RPM estimate to get a clean estimate of the machine RPM as a function the time. The
IJSER © 2012
International Journal of Scientific & Engineering Research, Volume 3, Issue 6, June 2012 4
ISSN 2229-5518
resulting RPM versus time function is defined for every
acquisition time point.
In the Tacho Spline Fite Wizard, set parameter to remove the effects of noise and missing pulses, set the trigger level,
slope, and hold off percentage, and select the number of
knots for the cubic spline fit. Handle rapidly changing RPM
data by inserting break points in the spline fit, see Fig.,(1).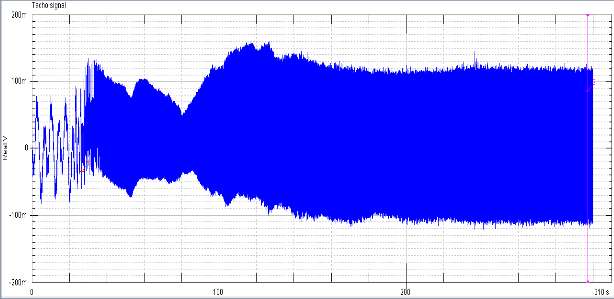
A-
Trigger point for positive trigger slope
Trigger point for negative trigger slope
% Percentage of Tacho pulse period T
during which Trigger point not accepted
Tacho pulse period T
Trigger point not accepted in this range RPM Spline Fit RPM Spline Fit
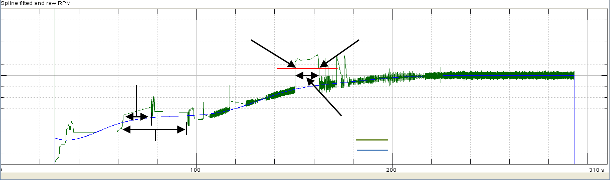
B-
Fig. 1. Removing outlying data points from Tacho measurement;
In the RPM Spectral Map Wizard, select the window type for the Fourier transforms the time block-size and the RPM range and resolution for the RPM spectral map[29].
IJSER © 2012
International Journal of Scientific & Engineering Research, Volume 3, Issue 6, June 2012 5
ISSN 2229-5518
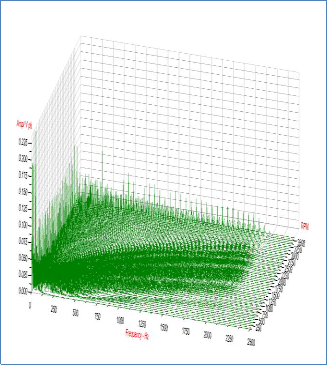
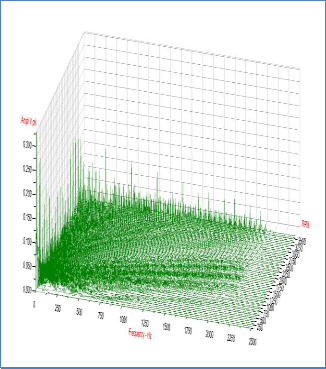
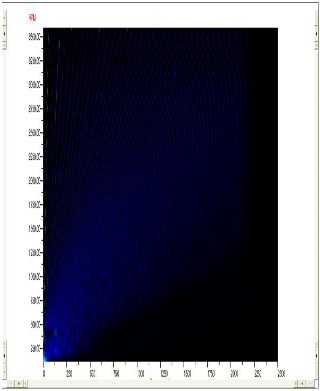
A- At speed 1000. B- At speed 2000.
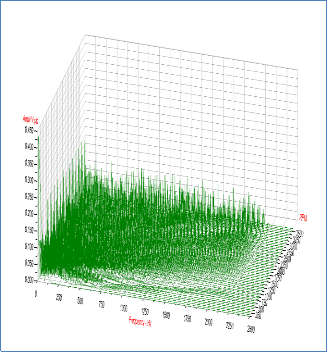
C- At speed 3000. D- At speed 4000.
IJSER © 2012
International Journal of Scientific & Engineering Research, Volume 3, Issue 6, June 2012 6
ISSN 2229-5518
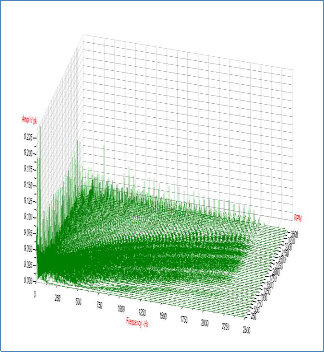
Resonance
Order Related Component
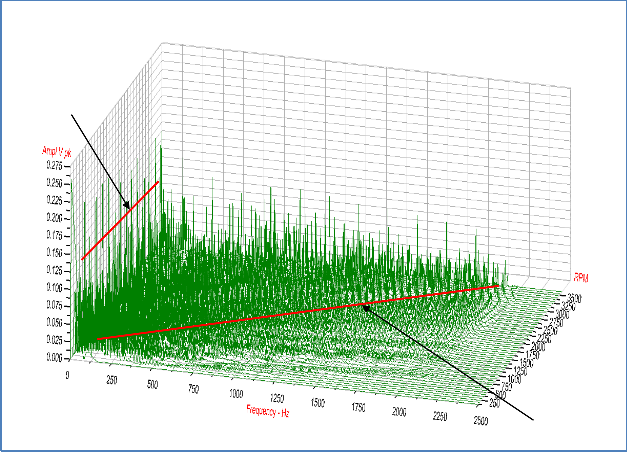
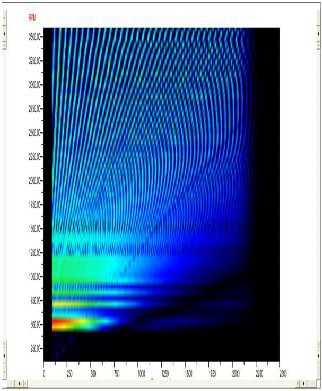
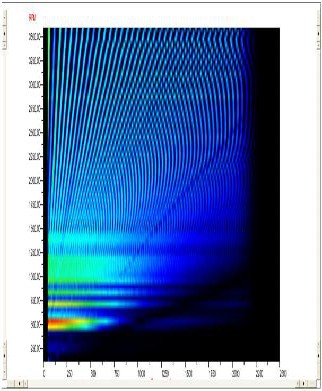
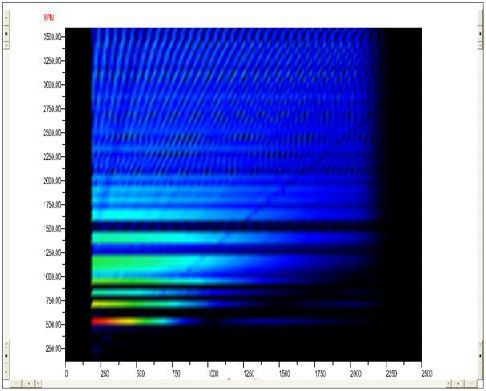
E- At speed 6000.
Fig. 2. RPM Spectral map wizard with resonances and order related components at different speeds of rotation (Waterfall display);
From Fig.,(2) we can see that the speed of rotor increases, the amplitude at the same value of the natural frequency rise accordingly. And you can conclude the rotational speed (angular velocity) of the rotor does affect on amplitude of the response.
You can switch between (a waterfall plot and colormap) displays see Fig. (3), when increase the speed of rotation is clear from the figures below increasing the amplitude.
IJSER © 2012
International Journal of Scientific & Engineering Research, Volume 3, Issue 6, June 2012 7
ISSN 2229-5518
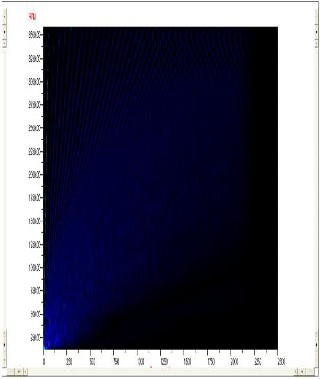
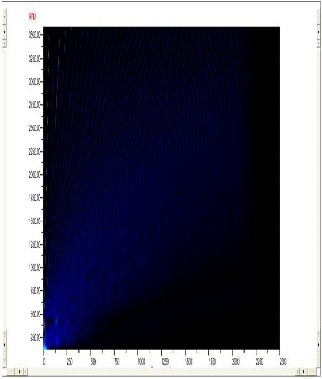
A- At speed 1000. B- At speed 1500.
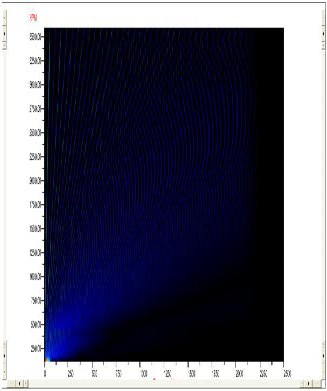
C- At speed 2000. D- At speed 2500.
IJSER © 2012
International Journal of Scientific & Engineering Research, Volume 3, Issue 6, June 2012 8
ISSN 2229-5518
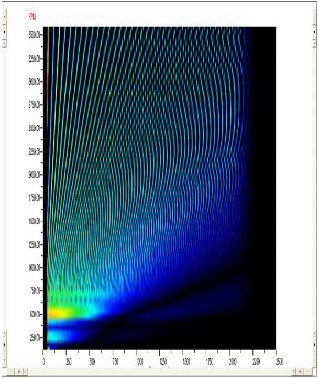
E- At speed 3000. F- At speed 4000.
G- At speed 5000. H- At speed 5500.
IJSER © 2012
International Journal of Scientific & Engineering Research, Volume 3, Issue 6, June 2012 9
ISSN 2229-5518
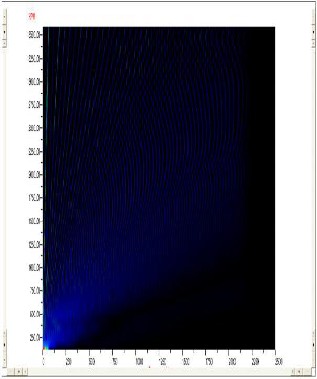
I- At speed 6000.
Fig. 3. RPM Spectral map wizard (Colormap displays) at different speeds of rotation;
From Fig.,(2) structural resonances occur at constant frequency lines in the map, while order related components vary frequency with RPM. Structural resonances can cause increases in vibration level with RPM. Resonances are fixed in frequency, and are straight lines in the map Fig., (2-E). Orders are multiples of the fundamental running speed of machine. Order related components move across the map, to the right as RPM increases. We can validate the result with colormap displays Fig.,(3) to proof the same fact .
From this study we can conclude the vibration analysis software can be used effectively to analyze new products, or to evaluate the vibration that occurs in rotating machinery. Using vibration analysis software for assessing machinery vibration is a cost-effective method to minimize down time and maximize equipment utilization.
The authors are grateful to Faculty of (SEC) in Kingston University London and the Iraqi Ministry of Higher Education, Iraqi cultural attaché in London for supporting this study.
REFERENCES
[1] MI. Friswell, JET. Penny, SD. Garvey and AW. Lees, Dynamics of Rotating Machineries. Cambridge University Press, UK, 2010.
[2] J.M. Vance, F. J. Zeidan, B. Murphy, Machinery Vibration and
Rotor-dynamics. John Wiley & Sons, Inc. Hoboken, New Jersey,
2010.
[3] I. Bucher, & D. J. Ewins,‛ Modal Analysis and Testing of Rotating Structures,‛ Philosophical Transactions of The Royal Society of London Series A-Mathematical Physical and Engineering Sciences, vol. 359, pp. 61–96, 1778, 2001.
[4] He Jimin, & Fu Zhi-Fang, Modal Analysis. Oxford, Active
Butterworth-Heinemann, 2001.
[5] M +P International, SO Analyser Operating Manual.
IJSER © 2012
International Journal of Scientific & Engineering Research, Volume 3, Issue 6, June 2012 10
ISSN 2229-5518
[6] J. H. Ginsberg, Mechanical and Structural Vibration, Theory and Applications. Georgia Institute of Technology, John Wily & Sons, Inc. United States, 2001.
[7] T. Yamamoto and Y. Ishida, Linear and Nonlinear Rotor- dynamics: A Modern Treatment with Applications, John Wiley & Sons, New York, NY, USA, 2001.
[8] D. E. Bently, C. T. Hatch, and B. Grissom, Fundamentals of Rotating Machinery Diagnostics, Bently Pressurized Bearing Press, Minden, Nev., USA, 2002.
[9] N. Bachschmid, and P. Pennacchi, ‚ Model Based Malfunction Identification From Bearing Measurements,‛ IMechE-7th International Conference on Vibrations in Rotating Machinery, September 12–14, pp. 571–580, University of Nottingham, UK,
2000.
[10] W.J. Chen, ‚A note on computational rotor dynamics‛, ASME Journal Vibration& Acoustic, vol. 120, pp. 228–233, 1998.
[11] F. F. Ehrich, Handbook of Rotor-dynamics, McGraw-Hill, New
York, NY, USA, 1992.
[12] D.J. Inman, Vibration with Control, Measurement and Stability, Chapter 2: Lumped parameter models, Prentice-Hall, Inc., New Jersey, 1989.
[13] B. C. Moore, ‚Principal Component Analysis in Linear Systems-Controllability Observability and Model Reduction,‛ IEEE Transactions on Automatic Control, vol. 26, no. 1, pp. 17–32,
1981. View at Publisher ·
[14] S. Okamoto, M. Sakata, K. Kimura, and H. Ohnabe,
‚Vibration Analysis of A High Speed and Light Weight Rotor System Subjected to A Pitching or Turning Motion II: A Flexible Rotor System on Flexible Suspensions,‛ Journal of Sound and Vibration, vol. 184, no. 5, pp. 887–906, 1995.
[15] P. Pennacchi, and A. Vania, ‚Measures of Accuracy of Model Based Diagnosis of Faults in Rotor-Machinery,‛ 2001b COMADEM, pp. 873–880, Manchester, UK, 2001.
[17] D.C. Kammer, ‚Sensor Placement for on-Orbit Modal Identification and Correlation of Large Space Structures,‛ Journal of Guidance, Control and Dynamics, vol. 2, no. 15, pp.
251-259, March-April, 1991.
[18] H.D. Irretier,‛ History and Development of Frequency Domain Methods in Experimental Modal Analysis,‛ Journal De Physique, vol. 12, no. 11, pp. 91–100, 2002.
[19] C. Hutin, ‚Modal Analysis Is Using Appropriated Excitation
Techniques,‛ Journal of Sound& Vibration vol. 34, no.10, pp.18-
25, 2000.
[20] N. Bachschmid, , P. Pennacchi, , E. Tanzi, , and A. Vania,
‚Accuracy of Modelling And Identification of Malfunctions in Rotor Systems: Experimental Results.‛ Journal of the Brazilian Society of Mechanical Sciences, XXII, vol. 3, pp. 423–442, 2000.
[21] Y.D. Joh, and C.W. Lee, ‚Excitation Methods and Modal Parameter Identification in Complex Modal Testing of Rotating Machinery,‛ International Journal of Analytical and Experimental Modal Analysis, vol. 8, no. 3, pp. 179-203, July,
1993.
[22] P. Pennacchi, , and A. Vania, ‚ Measures of Accuracy of
Model Based Identifications of Faults In Rotor-Machinery,‛
15th AIMETA Congress of Theoretical and Applied Mechanics,
2001a, Taormina, Italy, SP ME 48, 2001.
[23] Hillary, & D.J. Ewins,‛ The Use of Strain Gauge in Forces Determination and Frequency Response Function Measurements‛, Proceeding IMAC, vol. 2, 1984.
[24] D.J. Ewins, Modal Testing: Theory and Practice, John wily & Sons, London, England, 1984.
[25] R. Potter, and M. Gibler, ‚Computer Order Tracking Obsoletes Older Methods," SAE Noise and Vibration Conference, pp. 63-67, May 16-18, 1989.
[26] R. Potter, ‚A New Order Tracking Method for Rotating
Machinery,” Journal of Sound & Vibration, pp. 30-34, Sept., 1990. [27] S. Edwards, A. W. Lees, and M. I. Friswell, ‚Experimental Identification of Excitation And Support Parameters of A
Flexible Rotor-Bearings-Foundation System From A Single Rundown,‛ Journal of Sound and Vibration, vol. 232, no. 5, pp.963–992, 2000.
[28] P. Mahadevan, C. S. Jog, and A. Chatterjee,‚ Modal
Projections for Synchronous Rotor Whirl, ‚ Proceedings of the
Royal Society A, vol. 464, no. 2095, pp. 1739–1760, 2008.
[29] A. A. Younan, and A. El-Shafei, ‚Model Calibration of Anisotropic Rotor-Dynamic Systems with Speed-Dependent Parameters,‛ Journal of Engineering for Gas Turbines and Power, vol. 130, no. 4, Article ID 042502, 2008.
r

1Mr. Hisham A. H. Al-Khazali*, He has PhD Student in Kingston University London, and (SEM) member, Society for Experimental Mechanics. Inc., in USA. He was born in 28 Aug
1973 Baghdad/Iraq. He received his BEng in Mechanical Engineering (1996), University of Technology, Baghdad. MSc in Applied Mechanics, University of Technology, Baghdad (2000).
E-mail, k0903888@kingston.ac.uk
IJSER © 2012
International Journal of Scientific & Engineering Research, Volume 3, Issue 6, June 2012 11
ISSN 2229-5518

2Dr. Mohamad R. Askari, BSc (Eng), MSc, PhD, CEng, MIMechE, MRAeS. He has (Principal Lecturer, Blended Learning Coordinator), Member teaching staff in Kingston University London, His Teaching Area: Applied Mechanics, Aerospace Dynamics, Dynamics and Control, Structural and Flight Dynamics, Engineering Design, Software Engineering to BEng Mechanical and Aerospace second and final years. He was Year Tutor for BEng Mechanical Engineering Course and School Safety Advisor.
E-mail, M.Askari@Kingston.ac.uk
1Faculty of Science, Engineering and Computing (SEC), School of Mechanical
& Automotive Engineering,
Kingston University, London, SW15 3DW, UK.
2Faculty of Science, Engineering and Computing (SEC), School of Aerospace & Aircraft Engineering,
Kingston University, London, SW15 3DW, UK.
IJSER © 2012