International Journal of Scientific & Engineering Research, Volume 4, Issue 12, December-2013
ISSN 2229-5518
1775
Analysis of Staphylococcus using comparative
genomics.
Sunil S. Thorat and Prashant V. Thakare
Abstract— These Comparative genomics and genomic tools have been used to identify virulence factors and genes involved in environmental persistence of pathogens. However, a major stumbling block in the genomics revolution has been the large number of genes with unknown function that have been identified in every organism sequenced to date. Over 1740 bacterial genome sequences are currently available in public databases and over 5230 are in progress, representing hundreds of species as well as multiple strains of the same species. The study of these genomes by both computational and experimental approaches has significantly advanced our understanding of the physiology and pathogenicity of many microbes and provided insights into the mechanisms and history of genome evolution. Several ‘‘postgenomic’’ methods have been utilized to identify genes that are essential for bacterial growth or pathogenesis. Here we demonstrate the utility of several DNA and protein sequence comparison tools to interpret the information obtained from several genome projects. Comparisons are presented between closely related strains of Staphylococcus aureus and S. epidermidis spp. The comparative genome analysis will generate a wealth of data to compare pathogenic strains with varying levels of pathogenicity, which in turn may reveal mechanisms by which the pathogen may adapt to a particular host.
Index Terms— Comparative Genomics, GenePlot, TaxPlot.
—————————— • ——————————
1 INTRODUCTION
taphylococci are Gram-positive bacteria which play an important role in infectious disease [1]. Staphylococcus is one of the major causes of community-acquired and hospi-
tal-acquired infections. It produces numerous toxins including
from gene finding to the identification of regulatory elements [8-11]. Comparative genomics is the analysis and comparison of genomes from different species. The purpose of compara-
tive genomics is to gain a better understanding of how species
IJSER
superantigens that cause unique disease entities such as toxic-
shock syndrome and staphylococcal scarlet fever, and has ac- quired resistance to practically all antibiotics [2]. Staphylococcus aureus and Staphylococcus epidermidis are significant in their interactions with humans. S. aureus colonizes mainly the nasal passages, but it may be found regularly in most other ana- tomical locales. S. epidermidis is an inhabitant of the skin [3]. Staphylococcus aureus and S. epidermidis are major causes of infection related to biofilm formed on indwelling medical de- vices. Such infections are common causes of morbidity and mortality and are difficult to treat because of biofilm resistance to antibiotics [4].
Advances in automatic DNA sequencing technique and the whole-genome shotgun strategy have resulted in a tremendous increase in the amount of available genome data. These valuable data provided good subjects for experimental studies and functional analysis [5]. Comparative genomics has become more and more attractive, especially between two closely related species [6]. Comparing the genome sequences will lend insight into the evolution of drug resistance and lead to the identification of genes that can be targeted by a new generation of antibiotics [1].
Comparative genomics of encoded proteins with the database of existing annotated sequences is a useful approach to under- stand the information at the genome level. Once a genome sequence is available, a primary goal is to identify functional regions in the sequences, including genes and regulatory se- quences. Much of this identification will require new experi- mental work, but some information can be obtained purely computationally [7]. Comparative sequence analysis has be- come a powerful tool regarding a variety of problems ranging
have evolved and to determine the function of genes and non
coding regions of the genomes. Genome researchers look at many different features when comparing genomes: sequence similarity, gene location, the length and number of coding regions (exons) within genes, the amount of non coding DNA in each genome, and highly conserved regions maintained in organisms as simple as bacteria and as complex as humans. Genomic comparisons performed to find genes among closely related pathogens that differ in their host ranges have yielded contrasting data [12]. Though whole genome analysis of Staphylococcus aureus and genome-based analysis of virulence genes in Staphylococcus epidermidis has been reported, com- parative genome analysis of all the available Staphylococcus species may be necessary step toward future development of countermeasure against this organism.
2 METHODOLOGY
2.1 Extraction of genomic data
The source of genomic data was NCBI Reference Sequence collection [13], available on NCBI ftp server (ftp://ftp.ncbi.nih.gov/genomes/Bacteria/) as individual files in GenBank format. The data was gathered and compiled for all the selected genomes in order to retrieve information as homogeneous and consistent. The complete genome entry files were stored in local database in a proper format to retrieve various attributes of genome features for genomic studies. The information was stored as structural data together with complete information of each genome for manual examination and data curation. Once the batch of initial data was loaded in the local database, it was enriched with additional information retrieved from public repositories to the functional annotation of proteins coded by each genome.
IJSER © 2013 http://www.ijser.org
International Journal of Scientific & Engineering Research Volume 4, Issue 11, November-2013
ISSN 2229-5518
2.2 Comparative genome analysis
To compare Staphylococcus genome, various available tools and pre-computed data (PEDANT) was used and loaded in the local database for analysis. The PEDANT genome database (http://pedant.gsf.de) provides exhaustive automatic analysis of genomic sequences by a large variety of established bioin- formatics tools through comprehensive web-based user inter- face [14]. Based on PEDANT results, sequence entries homo- logues to known proteins, functional categories and other functional protein details, the genome analysis of selected Staphylococcus species was carried out.
The seven Staphylococcus genome strains namely COL, MRSA252, MSSA476, MW2, Mu50, N315 and Staphylococcus epidermidis ATCC12228 were studied for their comparative analysis, these genomes range in size from 2.49 Mb to 2.9 Mb and are composed of core and auxiliary (accessory) genes. From the selected seven Staphylococcus genomes Staphylococcus aureus strain MRSA252 was found to be largest genome with size 29,02,619 base pairs; however comparatively Staphylococcus epidermidis strain ATCC12228 was smaller in size i.e. 24,99,279 base pairs. The GC content of all selected seven genomes was common i.e. 32%; however strain MRSA252 and MSSA476 had least number of Percentage (%) coding i.e. 81% as compare to 83% for other strains. The molecule type of all genomes were single stranded DNA; however strain Mu50 and MW2 had double stranded DNA. Genes of Staphylococcus aureus MRSA252 was found to be more and protein coding regions of strain Mu50 was more i.e.
2696. Structural RNAs of strain MSSA476 was highest i.e. 104
as compare to other selected Staphylococcus genomes. From the other observations, strain COL, MSSA476 and MW2 shared most common similarities in 5s, 16s and 23s RNA cOotuhnertsw. eb tools were used for visualization of data for finding the GenePlot (http://www.ncbi.nlm.nih.gov/sutils/geneplot) and TaxPlot (www.ncbi.nlm.nih.gov/sutils/taxik2.cgi) for all the genomes. Pairwise genome comparison of all the six ge- nomes was done with Staphylococcus aureus COL strain as ref- erence genome to find the protein homologs to find the sym- metrical best hits which were developed in the form of dots by using visualization web tools.
3 GENEPLOT
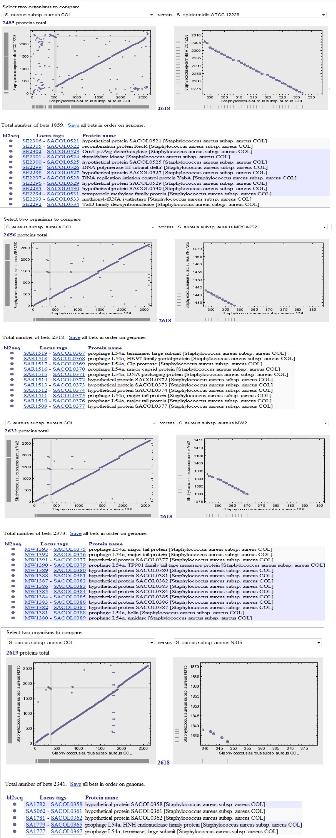
Entrez Genome offers a pairwise comparison tool called GenePlot to visualize similarities among bacterial genomes. To construct a GenePlot, genes were numbered sequentially along the genomic sequences of two organisms and the two corresponding sets of predicted proteins were compared using BLAST. For every case in which a pair or proteins, one from each genome were mutual best matches, a point is plotted using the indices of the equivalent gene in the two genomes as the X and Y coordinates. For nearly identical genomes, the GenePlot draws a diagonal line running from the lower left to the upper right-hand corners. Closely related genomes which undergo rearrangements shows segments displaced from, or running perpendicular to the main diagonal.
1776
IJSER © 2013 http://www.ijser.org
International Journal of Scientific & Engineering Research Volume 4, Issue 11, November-2013
ISSN 2229-5518
1777
Figure 1: Pair wise genome comparisons of protein homologs of Staphylococcus aureus COL (NC_002951), Staphylococcus epi- dermidis ATCC 12228 (NC_004461), S. aureus MSSA476 (NC_002953), S.aureus MRSA252 (NC_002952), S. aureus Mu50 (NC_002758), S.aureus MW2 (NC_003923) and S. aureus N315 (NC_002745)
Staphylococcus aureus strain COL Number of Proteins 2618 |
| Number of bets | Number of Proteins |
ATCC 12228 | 1859 | 2485 |
MRSA 252 | 2318 | 2656 |
MSSA 476 | 2346 | 2598 |
Mu50 | 2379 | 2731 |
MW2 | 2373 | 2632 |
N315 | 2341 | 2619 |
Table: 1. The annotated proteins of Staphylococcus aureus strain COL compared with Staphylococcus aureus strains MRSA252, MSSA476, Mu50, MW2, N315 and Staphylococcus epidermidis strain ATCC12228 genome proteins using GenPlot.
From the above results it was found that, Staphylococcus aureus strain COL has comparatively less number of proteins than MRSA252, Mu50, MW2 and N315 strains. In contrast, Staphy- lococcus epidermidis strain ATCC12228 and Staphylococcus aureus MSSA476 has less number of proteins than Staphylococcus aureus COL strain.
The left panel shows the comparison of both proteomes, while
the highlighted region in the left panel is magnified in the
right panel. The additional COL encoded proteins for which there is no similar protein in the other strain can be obtained by downloading all of the COL encoded proteins in the Entrez proteins database and subtracting the proteins that have best hit proteins in other strain. The resultant list represents pro- teins specifically annotated on the COL strain and are thus could be potential candidates for the pathogenicity of the COL strain.
The analysis of proteomes of Staphylococcus aureus strain COL
were compared with strains MRSA252, MSSA476, Mu50,
MW2, N315 and S. epidermidis strain ATCC12228. Among Staphylococcus spp., large inversions in the genome have been documented and a continuous gene sequence in one strain may occur into two segments separated by several kilo bases
in another. These regions have been termed as plasticity zones,
a large number of genes in this region are prophage L54a- specific and the region often has lower GC content than the rest of the genome. The gene list of the highlighted region is shown in the lower panel. If the highlighted region is inverted in the genome the gene identifiers (locus_tag numbers) will be in the decreasing order.
The comparisons were generated using GenePlot with precal- culated BLAST results for each genome. When Staphylococcus aureus strain COL is compared with strains MRSA252,
MSSA476, Mu50, MW2 and N315, Prophage L54a was found abundant among all Staphylococcus strains. However when compared with S. epidermidis strain ATCC 12228; protein thymidylate kinase and tetrapyrole methylase family proteins were observed. The region indicated by gray cross hair is zoomed in the panel on the right side and the proteins in this region are listed below. The columns in this table are gene identifiers and protein name. As a result of inversion in this region (plasticity zone), the locus_tags order in protein names is increasing, while decreasing locus_tags order is seen for gene identifiers.
TAXPLOT
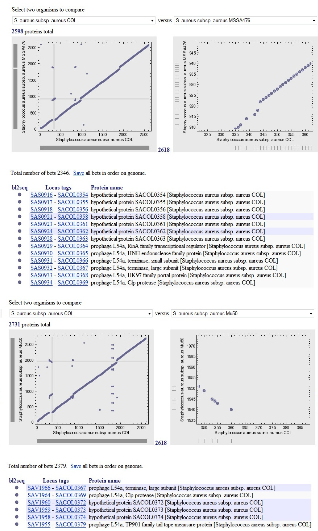
TaxPlot from NCBI server was used to compare the proteins encoded by the Staphylococcus aureus strain COL to that of an- other pathogenic strain S. aureus MSSA476 and S. aureus MRSA252. The resultant plot (Fig. 2a) shows that there are 595
COL proteins equally similar to the MRSA252 and MSSA476
proteins (represented along the diagonal), and a very large
IJSER © 2013 http://www.ijser.org
International Journal of Scientific & Engineering Research Volume 4, Issue 11, November-2013
ISSN 2229-5518
1778
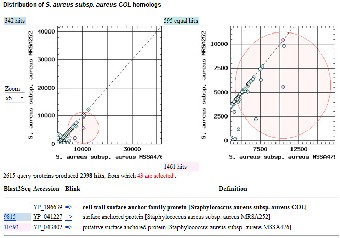
number of the Staphylococcus aureus strain COL proteins (1461) are more similar to the MSSA476 proteins than the MRSA252 proteins. Only 342 proteins were more similar to MRSA252 than MSSA476. The set of 1461 proteins represent proteins common in the two pathogenic strains. The proteins can be identified by clicking on the circles. The most similar protein between the two pathogenic strains (similarity score of 10591) is a surface putative surface anchored protein with a weak similarity to the surface anchored protein of MRSA252 (simi- larity score of 9815).
The proteomes of Staphylococcus aureus strain COL were com- pared with those of strain MW2 and Mu50. A three way com- parison as shown in Fig 2b indicates that the COL proteome is more similar to the proteome of MW2 (836 COL proteins more similar to MW2) than the Mu50 proteome (only 594 proteins of COL more similar to Mu50). There are 971 COL proteins equally similar to MW2 and Mu50 proteins, thus they are plot- ted along the diagonal. The COL strain protein most similar to MW2 is a hypothetical protein MW1390 with a weak similarity to Mu50 phi PVL ORF 15 and 16-like proteins. The subset of proteins among the 836 proteins common to strains COL and MW2 would be likely candidates for the virulence mechanism.
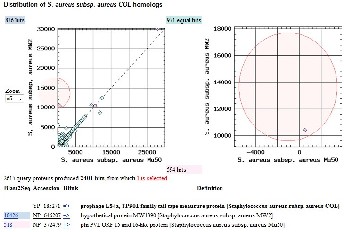
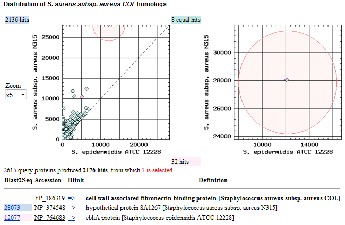
Next we compared the proteomes of Staphylococcus aureus strain COL with those of strain N315 and non-pathogenic strain Staphylococcus epidermidis ATCC12228. A three way comparison as shown in Fig 2c indicates that the COL pro- teome is more similar to the proteome of N315 (2136 COL pro- teins more similar to N315) than the ATCC12228 proteome (only 32 proteins of COL more similar to ATCC12228). There
are 8 COL proteins equally similar to N315 and ATCC12228
proteins, thus they are plotted along the diagonal. The COL strain protein most similar to ATCC12228 is ebhA protein with a weak similarity to N315 hypothetical protein SA1267. The subset of proteins among the 32 proteins common to strains COL and ATCC12228 would be likely candidates for the func- tion of adhesion.
Fig 2: Three way protein homology-based comparisons of
S. aureus strains using TaxPlot.
(a) BLAST scores of S. aureus COL (NC_002951) strain com- pared with MRSA252 (NC_002952) (y-axis) and MSSA476 (NC_002953) (x-axis). The COL proteins equally similar to the MRSA252 and MSSA476 proteins are plotted along the diago- nal. COL proteins that are asymmetrically similar to MSSA476 appear off the diagonal. The COL protein most similar to MSSA476 proteins is highlighted by red circle and that region is zoomed in the right hand side panel. The RefSeq accession number of these proteins and their description, and similarity information to MRSA252 and MSSA476 proteins is listed be- low. The cell wall surface anchor family protein is more simi- lar to MSSA476 compared to MRSA252 (BLAST similarity scores 10591 vs 9815, respectively). (b) BLAST scores of S. aureus strain COL (NC_002951) are compared with MW2 (NC_003923) (y-axis) and Mu50 (NC_002758) (x-axis). The COL proteins equally similar to the MW2 and Mu50 proteins are plotted along the diagonal. One of the COL proteins more similar to the MW2 protein is highlighted by red circle and that region is zoomed in the right hand side panel. The RefSeq accession number of this protein and its description, and simi- larity information to MW2 and Mu50 proteins is listed below. (BLAST similarity scores of 518 vs 10426 respectively). (c)
IJSER © 2013 http://www.ijser.org
International Journal of Scientific & Engineering Research Volume 4, Issue 11, November-2013
ISSN 2229-5518
1779
BLAST scores of S. aureus strain COL (NC_002951) are com- pared with N315 (NC_002745) (y-axis) and S. epidermidis strain ATCC 12228 (NC_004461) (x-axis). The COL proteins equally similar to the N315 and ATCC 12228 proteins are plotted along the diagonal. One of the COL proteins more similar to the N315 protein is highlighted by red circle and that region is zoomed in the right hand side panel. The RefSeq accession number of this protein and its description, and similarity in- formation to N315 and STCC 12228 proteins is listed below. (BLAST similarity scores of 12077 vs 28073 respectively).
5 CONCLUSION
Comparative analysis of Staphylococcus species has revealed the functions of genes coding for its differences among other strains and also gave insight on its pathogenicity. When compared using GenePlot with precalculated BLAST results for each genome of selected Staphylococcus strains, the plasticity zones were found to be Prophages especially L54a which has a history of pathogenesis infections. The proteomic analysis of Staphylococcus species using three way comparison indicated that strain Mu50 possess phi PVL ORF
15 and 16 like protein which suggests a likely candidate for the virulence mechanism. While comparing with Staphylococcus
[4] Dell'Acqua G, Giacometti A, Cirioni O, Ghiselli R, Saba V, Scalise G, Gov Y, and Balaban N. (2004) Suppression of Drug-Resistant Staphylococcal In- fections by the Quorum-Sensing Inhibitor RNAIII- Inhibiting Peptide. J Infect Dis. 190(2), 318-20.
[5] Florea, L., Riemer, C., Schwartz, S., Zhang, Z., Stojanovic, N., Miller, W., McClelland, M. (2000). Web-based visualization tools for bacterial genome alignments. Nucleic Acids Res. 28, 3486-3496.
[6] Canepari, P., Varaldo, P.E., Fontana, R. and Satta,
G. (1985) Different staphylococcal species contain various numbers of penicillin-binding proteins ranging from four (Staphylococcus aureus) to only one (Staphylococcus hyicus). J. Bacteriol. 163(2). 796-
798.
[7] Jareborg, N., Durbin, R. (2000). Alfresco-a workbench for comparative genomic sequence analysis. Genome Res. 10, 1148-1157.
[8] Morgenstern, B., Rinner,O., Abdeddaim,S.,
Haase,D., Mayer,K.F., Dress,A.W. and Mewes,H.W. (2002) Exon discovery by genomic sequence alignment. Bioinformatics, 18, 777–787.
[9] Wiehe,T., Gebauer-Jung,S., Mitchell-Olds,T. and
IJSER
epidermidis strain ATCC 12228, a protein ebhA showed
similarity which had adhesin function. When compared among other methicillin resistant strains, surface anchored proteins were prevailed. As fully annotated genome sequences of outbreak strains become available, these data sets will form a basis for addressing how human pathogens have diversified and evolved in genome contents. The data analysis will very
Guigo,R. (2001) SGP-1: prediction and validation of homologous genes based on sequence alignments. Genome Res., 11, 1574–1583.
[10] Loots,G.G., Ovcharenko,I., Pachter,L., Dubchak,I. and Rubin,E.M. (2002) rVista for comparative sequence-based discovery of functional transcription factor binding. Genome Res., 12, 832–
likely provide insights on best possible ways to classify
intrinsic genomic differences among closely related strain with regard to clinical presentation and disease severity.
ACKNOWLEDGMENT
The authors wish to thank IBSD and DBT for the permission
[11]
8G3o9t.tgens,B., Barton,L.M., Chapman,M.A., Sinclair,A.M., Knudsen,B., Grafham,D., Gilbert,J.G., Rogers,J., Bentley,D.R. and Green,A.R. (2002) Transcriptional regulation of the stem cell leukemia gene (SCL)-comparative analysis of five vertebrate SCL loci. Genome Res., 12.
and support of this work.
REFERENCES
[1] Georgopapadakou, N.H. and Liu, F.Y. (1980) Bind- ing of β-Lactam Antibiotics to Penicillin-Binding Proteins of Staphylococcus aureus and Streptococcus faecalis: Relation of Antibacterial Activity. Antim- icrob. Agents and Chem. 18(5), 834-836.
[2] Kuroda, M., Ohta, T., Uchiyama, I., Baba, T., Yuzawa, H., Kobayashi, I., Cui,l., Oguchi, A., Aoki, K., Nagai, Y. et al. (2001) Whole genome sequencing of meticillin-resistant Staphylococcus aureus. Lancet.
357, 1225-1239.
[3] Kenneth Todar. (2004) http://textbookofbacteriology.net/staph.html.Univ ersity of Wisconsin-Madison Department of Bacteriology.
[12] Bhagwat, A.A. and Bhagwat, M. (2008) Methods
and tools for comparative genomics of food-borne pathogens. Foodborne Pathog Dis. 5(4). 487-497.
[13] Pruitt,K.D. and Maglott, D.R. (2001) RefSeq and LocusLink: NCBI gene-centered resources. Nucleic Acids Res., 29, 137-140
[14] Frishman.,D.,et al.,(2003) The PEDANT genome
database. Nucleic Acids Res., 31(1).207-211.
IJSER © 2013 http://www.ijser.org