International Journal of Scientific & Engineering Research, Volume 6, Issue 5, May-2015 1748
ISSN 2229-5518
Analysis of Noise Pollution in Selected Areas of Ota, Nigeria
Marvel L. Akinyemi, Moses E. Emetere and Longe O. Tolu
Physics Department, Covenant University, Canaan land, Ota, Nigeria
Abstract
The physiological effects of noise pollution are alarming. Its visible effect on hearing damage, cardiovascular, childhood hypertension and hormonal disturbances are evident in developing communities. Six locations were selected in Ota, Nigeria. Data set obtained from the digital sound level meter was used to model the noise climate and the equivalent continuous noise level. While the noise climate of the mini-market was predictive in nature, the noise climate in the secondary school was very high and not predictive.
Keyword: noise pollution, sound level, adverse effect, analysis
Introduction
Noise pollution have been proven to associated to physiological effects such as hearing damage (WHO, 1999), cardiovascular (Babisch et al., 2000), childhood hypertension (Evans et al., 1993) and hormonal disturbances. Exposure to high levels of noise, even for a short period of time may lead to a temporary loss of hearing. For example, when employees are exposed to high levels of noise every working day for many years, they gradually develop a permanent hearing loss. Noise pollution has a longer lasting negative effect on people. In developing countries the level of noise pollution is not checked, hence, individuals are exposed to it all day long. There are kinds of noise pollutions. The most common class of noise is the community noise and the industrial noise. Community noise is emitted from all sources except the industrial workplace. Community noise emanates primarily from road networks, rail, traffic congestions, industries, construction, and the neighborhood (WHO, 1999). Also, noise can be classified with respect to frequency. For example, noise with low frequency from 200Hz and below; noise with medium frequency ranges between 200Hz and 2000Hz; noise with high frequency ranges from 2000Hz and above. Amazingly, noise cannot be measured directly, what can be measured is the sound level. Sound level is measured in decibels (dB), by a device called a sound level meter. The sound level can
be sensed orally via the auditory system which processes information hundreds of times faster
IJSER © 2015 http://www.ijser.org
International Journal of Scientific & Engineering Research, Volume 6, Issue 5, May-2015 1749
ISSN 2229-5518
than photoreceptors or olfactory neurons in microseconds versus hundreds or milliseconds (See figure 1). This feat is possible because the auditory system has the fastest metabolic rate in the brain (Hudspeth et al., 2003). Hence the human ear can respond to minute pressure variations in
the air if they are in the audible frequency range, roughly 20 Hz - 20 kHz.
Figure 1: The auditory system and sound perception (C. R. Nave 2014)
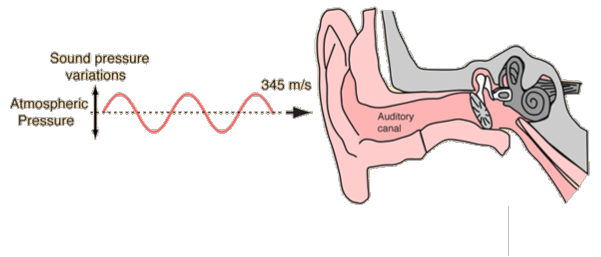
The phon is a non-standard noise unit that is designed to reflect perceived loudness can be calculated in form of decibel. For example, if a sound of 80 phons is equivalent to a sound as loud as a *0-dB, 1-kHz tone. Another non-standard noise unit is the sone. 1 sone is equal to 40 phons. In this paper, we examine the different level of noise effects in selected regions of Ota- ranging from secondary schools, bus terminal, university e.t.c.
Noise pollution indices
We adopted the Gaussian positional technique to calculate the noise pollution of each locations. Here, we adopted various positions ranging from P1 to P50 which was obtained directly from sampled data. Like the Gaussian percentile technique (Rajiv et al., 2012), the noise climate (NC) was obtained. The NC can be used to determine the Equivalent Continuous Noise Level (Leq) and Noise Pollution Level (Lnp).
𝑁𝐶 = 𝐿𝑚𝑎𝑥 − 𝐿𝑚𝑖𝑛 [1]
𝐿𝑒𝑞 = 𝐿𝑥 + �

(𝑁𝐶)2 � [2]
60
IJSER © 2015 http://www.ijser.org
International Journal of Scientific & Engineering Research, Volume 6, Issue 5, May-2015 1750
ISSN 2229-5518
𝐿𝑛𝑝 = 𝐿𝑒𝑞 + 𝑁𝐶 [3] Here, 𝐿𝑥 are the various positions obtained directly from sampled data.
Acquisition of Data
The selected locations for this research include secondary schools, bus terminal, university, religious centers e.t.c. These locations are made up of high population, whose daily activities leads to noise pollution. A total of six locations were selected for this research (as mentioned above). The equipment used is a digital sound level meter (mannix testing and measurements model - DSM8922). The equipments measuring range 30 to 130 dB and a resolution of 0.1 dB. DSM8922 has a frequency range of 31.5 Hz to 8KHz which conforms to the EN 50081-1/1992 and EN 50082-1/1997 standards. DSM8922 is electromagnetically compatible with high safety precision. Noise measurements were carried out 50m away from noise source and every 5m towards the noise source and the measurements were taken in the afternoon (2:00-3:00pm) during the peak of the days’ work in order to get the maximum noise from the various selected locations. The basic precautions taken to ensure accuracy includes ensuring that the digital sound level meter was held at a distance not less than 1m away from any reflecting object and at a height of 1.2m above the ground in accordance with the European Union (EU) Directive
86/188/EEC.
Result and Analysis
60
55
50
45
40
35
30
location 1
25
location 2
20 location 3 location 4
15 location 5 location 6
10
0 5 10 15 20 25 30 35 40 45 50
Position from noise (m)
IJSER © 2015
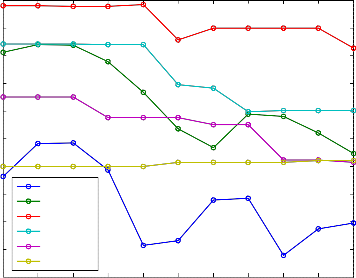
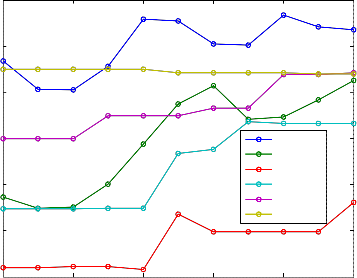
Figure 2: Noise climhttpa:/t/wewwo.ifjsetr.horeg six locations
International Journal of Scientific & Engineering Research, Volume 6, Issue 5, May-2015 1751
ISSN 2229-5518
The six locations considered were location 1 is the Mini-market, location 2 is bus terminal, location 3 is secondary school, location 4 is restaurant, Location 5 is the university and location 6 is religious centers. The noise climate of location 3 is the highest. This means that the students are highly exposed to hearing damage (WHO, 1999), cardiovascular (Babisch et al., 2000), and childhood hypertension (Evans et al., 1993). The mini-market possessed the lowest noise
climate.
105
100
95
location 1 location 2 location 3 location 4 location 5 location 6
90
85
80
75
70
0 10 20 30 40 50
Position from noise (m)
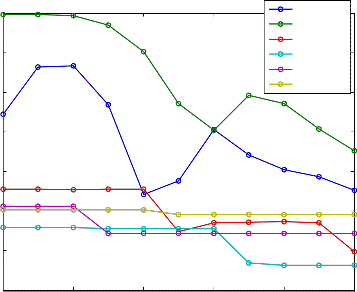
Figure 3: The maximum sound level for six locations
Location 3 has the highest maximum sound level. It is nearly accurate for bus terminal to possess the highest maximum sound level due to blare from vehicular activities. The restaurant has the lowest maximum sound level. Location 1 possessed the highest minimum sound level. This is affirmed by the noise climate simulation in figure 2. The sinusoidal nature of the noise climate of the mini-market is unique compared to other locations. This means the level of activity is
predictive and can be controlled.
IJSER © 2015 http://www.ijser.org
International Journal of Scientific & Engineering Research, Volume 6, Issue 5, May-2015 1752
ISSN 2229-5518
location 1
80 location 2 location 3 location 4
70 location 5 location 6
60
50
40
30
20
0 10 20 30 40 50
Position from noise (m)
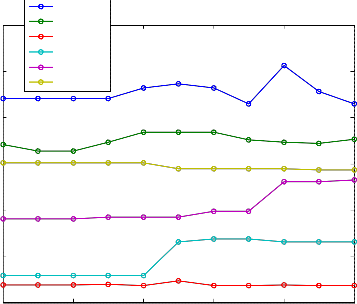
Figure 4: Minimum sound level of six locations
50
40
30
20 location 1 location 2
location 3
10 location 4 location 5
location 6
0
-10
0 10 20 30 40 50
Position from noise (m)
Figure 5: Equivalent continuous noise level for six locations
The predictive nature of the mini-market is further confirmed by the equivalent continuous noise
level. This affirms that a near regular sinusoidal noise climate depends on its continuity in
IJSER © 2015 http://www.ijser.org
International Journal of Scientific & Engineering Research, Volume 6, Issue 5, May-2015 1753
ISSN 2229-5518
transmission. The secondary school showed less-predictive features due to its low equivalent continuous noise level shown in figure 5. Generally, figure 5 showed that as acoustic activities increases linearly to the background, acoustic noise level decreases exponentially, this shows that as the signals move away from the noise source, the background acoustic also decreases as the background acoustic fades away. Also, figure 5 further shows that the closer the observer is to the source of sound, the sharper the sound is perceived by the human ear.
Conclusion
The study of the research shows that the predictive nature of the acoustic activities is worrisome except for the mini-market. The environment control may be difficult to proffer in this case. The noise climate in the secondary school portrays danger i.e. students are highly exposed to hearing damage (WHO, 1999), cardiovascular (Babisch et al., 2000), and childhood hypertension (Evans et al., 1993).
Acknowledgement
The authors appreciate the partial sponsorship of Covenant University
Reference
1. Babisch, W (2000), Epidemiological Studies of Cardiovascular Effects of Traffic Noise, Noise Effect 1999 Congress Proceedings, Vol. 1, pp 221-229.
2. Evans, GW & Lepore, SJ (1993), ‘Non-auditory effects of noise on children’, Children’s
Environment, Vol. 10, pp. 31–51.
3. Hudspeth, AJ & Konishi, M (2000) ‘Auditory neuroscience: Development, transduction and integration’, Proceedings of the National Academy of Sciences, Vol. 97, No. 22, pp
11690–691.
4. Nave C. R. (2014), Sensitivity of human ear. http://hyperphysics.phy-astr.gsu.edu/ Dept of
Physics and Astronomy, Georgia State University
5. Rajiv B. Hunashal, Yogesh B. Patil, (2012 ), Assessment of noise pollution indices in the city of Kolhapur, India, Procedia - Social and Behavioral Sciences 37, 448 – 457
6. WHO, 1999, Effects of community noise, pp. 44-49
IJSER © 2015 http://www.ijser.org