International Journal of Scientific & Engineering Research, Volume 5, Issue 1, January-2014 29
ISSN 2229-5518
An Experimental Analysis of Stress Relaxation in
Nonwoven Fabrics
Sajid Ahmed Qureshi
ABSTRACT - The current research deals with an analysis of stress relaxation in nonwoven fabrics with different gsm values with a view to understand how these nonwovens behave under an applied stress for a given load over a constant period of time. An electronic stress relaxation tester was designed indigenously for this purpose which works on the strain gauge principle of measuring loads applied to the specimen at any given instant of time during the experiment. The respective stress values were calculated for corresponding load values for each specimen with every thirty seconds passage of time. The results obtained were graphically analyzed and it was revealed that the stress relaxation percentage was significantly different for the same nonwoven materials but with different gsm values. It was observed that nonwovens do possess the property of decaying the stress generated due to external loads and the extent to which this happens depends to a considerable extent on the gsm of the structure along with other factors like type of fibers and type of bonding.
Index Terms – bonding, gsm, nonwovens, load, stress relaxation, strain gauge, stress decay;
—————————— ——————————
Textile materials being visco-elastic in nature do respond with time to the external loads and stress. A material which
Stress relaxation is one of the areas where an extensive work has been carried out which continues to attract
IJSER
is stressed decays with respect to time. This phenomenon
would be exhibited even at very low stress levels. This
property is basically related to the basic structure of fibers
and packing of the fibers in the yarns and fabrics. This
property also dictates the usefulness of fibers in its
subsequent use. Elastic recovery, resilience, plasticity, creep and stress relaxation are all concerned with the dimensional stability of a fiber, yarn or fabric under the action of mechanical forces, and they are useful in evaluating functional properties of a fabric. For the purpose of investigating a mechanical property, four main types of deformations can be distinguished namely stretch, twist, bend and compression. These result in tests which are called tensile, torsional, flexural and compressive, respectively. The measurements are associated with parameters like stress and deformation. Time is an important factor when considering the relaxation between stress and strain particularly in textiles. This means that we must always deal with the stress, strain and time behavior. It is desirable to keep one of the variables at a constant value while studying the effect of the other two.
————————————————
• Sajid Ahmed Qureshi is currently working as Asst. Professor in the Department of Textile Engineering, Kombolcha Institute of Technology, Wollo University, Ethiopia.
PH- 00251912772681;
E-mail:saq1234@gmail.com
research workers. Study of stress relaxation calls for both
good instrumental technique and patience since it is a time dependent test. Quite often the stress relaxation has been measured using universal tensile testing instruments like Instron. Working with Instron needs operative skill and is also quite expensive. A standalone instrument to measure the stress relaxation is not available. In recent years electronics and computers have been playing a good role in the field of textiles. An effort has thus been made to design, develop and fabricate a low cost electronic stress relaxation tester which can be interfaced with a computer system to get instantaneous results and comparative statements.
Some of the aspects associated with stress and relaxation phenomenon of visco-elastic materials is mentioned here under.
Visco elasticity is concerned with materials which exhibit strain rate effects in response to applied stresses. These effects are manifested by the phenomenon of creep under constant stress and stress relaxation under constant strain. These time dependent phenomena may have a considerable effect on the stress distribution developed in a specimen; such as thick tube made of visco elastic material subjected to prescribed loads or prescribed surface displacements. The stress and/or strain at specific point in the material may vary significantly with time even though the applied forces remain constant. In order to be able to predict the
IJSER © 2014 http://www.ijser.org
International Journal of Scientific & Engineering Research, Volume 5, Issue 1, January-2014 30
ISSN 2229-5518
change in stress and strain with the time a visco-elastic stress analysis method is needed.
The behavior of an individual fiber under a gradually increasing applied force is completely expressed by the load elongation curve with its end point breakage. In most physical and engineering applications load is replaced by stress, defined as:
Stress = Load / Area of cross section in N / Cm2
To take account of length of the specimen, the elongation is expressed as tensile strain or percentage extension.
Tensile Strain = Elongation / Initial Length
Load elongation curves become stress-strain curves by a change of units, without affecting the shape of the curves.
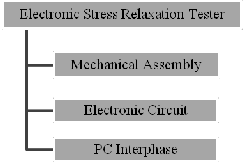
The methodology adopted in the fabrication of the electronic fabric stress relaxation tester is briefed here. It involves a co-ordination of the three following segments:
Fig. 1. Instrument Segments
In general, almost all instruments have similar functional elements which are depicted in the following flow chart.
IJSER
Visco elastic materials subjected to a constant load will relax under constant strain, so that the stress gradually decreases. From a study of three time dependent responses (creep, recovery, relaxation) the basic principles governing the time-dependent behavior under loading conditions may be established.![]()
In actual practice, stress or strain history may approximate one of the three time dependent responses or a mixture i.e., creep and relaxation may occur simultaneously under combined loading or the load or strain history may be cyclic or a random variation. Observation of the relaxation of stress at constant strain is not all that simple to interpret theoretically, because the external geometry of the specimen remains unchanged throughout the test.
To understand the stress-relaxation phenomena which call for inducing the stress in the material by subjecting it to a certain amount of deformation and then to record the stress in the material as the time progresses, various methods can be employed.
It is proposed to have a strain gauge which helps to transduce the stress present in the material which can be read conveniently on a digital panel meter. The advantage would be that the information can also be fed to an analog processor or a digital processor and auto recordings can be obtained.
We can also describe both, the operation and performance
of measuring instruments in a generalized way without
considering the specific physical hardware. The operation can be described in terms of functional elements shown below:![]()
Primary sensing element
![]()
Variable conversion element
Manipulation element
![]()
![]()
Data transmitting element Data presenting element
Fig. 2. Important Functional Elements
IJSER © 2014 http://www.ijser.org
International Journal of Scientific & Engineering Research, Volume 5, Issue 1, January-2014 31
ISSN 2229-5518
This is the physical quantity which is actually measured. It may be any physical medium such as pressure, temperature, load, speed etc.
It is element which first receives energy from the measurand and produces an output depending on the measured quantity. This elements in the instrument is actually known as a transducer or load cell. While sensing the measurand, the primary sensing element always extracts the same amount of energy from the measurand to which it is subjected to. Strain gauges are used as the primary sensing element or transducer in the electronic stress relaxation tester.
The output of the primary sensing element is a variable such as voltage or change in resistance, inductance,
capacitance etc. For the instrument to perform necessary
Load cells contain strain gauges arranged in a suitable form and bonded onto an elliptical ring surface. Strain gauges in a transducer contain a resistance wire which is wound in a specific fashion and enclosed a backing material to avoid atmospheric effects. The deformation of strain gauge resistance wire causes a change in its length and area of cross section. Since resistance of a wire depends upon its length and area of cross section, loading of load cell causes changes in resistance of strain gauges. When the strain gauges are not loaded and mounted in the arms of the Wheatstone’s Bridge, there should not be any output at the output terminals of the bridge. The input terminals are given a D.C. excitation voltage and the output terminals are connected to an amplifier with digital panel meter to display the output. So, when the input terminals of the bridge give an input value, the output terminals should read zero voltage i.e., it’s a balanced bridge. Whenever the load cell is subjected to a load, because of change in resistance of strain gauge resistance wires, the bridge circuit will get unbalanced and the output terminals read some voltage which is fed to an amplifier.
the function, it is essential Ito conJvert this varSiable which ER
contains the information of the original signal. An element that performs such kind of operation is termed as variable conversion element.
![]()
Sometimes it may be necessary to manipulate the signal from the variable conversion element, say a change from milli-volts to a corresponding change in volts. Thus an electronic amplifier which performs such type of manipulation may be included as the variable manipulation element.
It may sometimes be necessary to transmit the data from one place to other. The element which performs this task is called a data transmitting element. The data transmitting element may be as simple as a co-axial cable or as complex as a telemetric system.
If the information has to reach the observer with a view to monitor or control the signal must be put into a recognized form for human senses such as audio signals, scales, monitors etc. An element that performs this task is called the data presenting element.
TABLE 1
LOAD CELL SPECIFICATIONS
![]()
Range 0-30 Kg![]()
Type Ring type
Sensor Resistance type strain gauge![]()
Bridge configuration 4 Arm![]()
![]()
Sensitivity 0.2 mV/FSD Output Connection Through 4 core
cable![]()
![]()
Temperature 0-550 C Linearity + 0.1% FSD![]()
and hysteresis
IJSER © 2014 http://www.ijser.org
International Journal of Scientific & Engineering Research, Volume 5, Issue 1, January-2014 32
ISSN 2229-5518
Strain gauges are bonded on to an elliptical circuitry ring surface and these strain gauges are connected in the form of wheat stone’s bridge as shown in the fig. The output of the bridge is connected to the digital display amplifier through the cable supplied.
It is the other main component of stress relaxation tester. As stated earlier the bridge output from a load cell has to be fed to an amplifier which amplifies the signal output on a digital panel meter which is calibrated to read the stress in engineering units (Kg). The instrument operates on a 230
Volts, 50 Hz A.C. The output from the load cell has to be
modified before it becomes usable and satisfactory to drive the signal presentation stage which is the final stage of the
Strain gauge
Strain gauge
Bridge output
Strain gauge

Excitation voltage
Strain gauge
measurement process. The final stage of measurement consists of indicating, recording, displaying, data processing or controlling elements. The stress sensed by
load cell is amplified by processing through the electronic circuit.
The digital instrument indicates the value of the measurand in the form a decimal number. In electronic stress relaxation
Fig. 3. W heatstone’s Bridge
tester the loading of load cell by any means results in the corresponding load value at the digital display panel. The digital panel meter in this instrument is calibrated to read
IJSEthe load direcRtly in grams.
• Strain gauge wires should have high sensitivity in
order to keep the current flow and consequent heat dissipation low.
• Strain gauge wires should have low temperature co-efficient of resistance. Thus gauge sensitivity to ambient temperature is low.
• Gauge wire should have a stable resistance.
• Gauges should have high gauge factor or unit change in resistance per unit change in load should as high as possible.
• Strain gauges should have low thermal e.m.f at copper terminals.
• Wire should have creep strength and yield stress.
• Gauge should have low hysteresis in the stress cycle.
• Gauge should be small in size in the order of 1 mil so that appreciable elongations will be produced with the forces measured.
The instrument has a fixed upper jaw connected to the load cell and a movable lower jaw. The specimen to be tested is first taken for the breaking extension test using the fabric tensile strength tester. Half of this breaking load is taken for extending the fabric to produce a stress which will result in an ideal relaxation. The specimen is fixed between the 2 jaws by operating the screws. Care must be taken to see that the sample to be tested is firmly gripped between the jaws without any twist and the knobs should be tightened properly to avoid any slippage at the jaws. Specimen length can be adjusted by fixing the moveable lower jaw to the required position.
Load is applied to the specimen by pulling the lower jaw downwards till we get the required load which gets displayed on the digital panel meter. The knobs of lower jaw is then to be tightened. Before starting the experiment the instrument has to be switched on for 2 minutes to warm up and then the load reading gets set to zero. As soon as the lower jaws position is fixed the reading on display and the time are automatically recorded by the computer system. The time-stress curves at fixed intervals are plotted automatically online.
IJSER © 2014 http://www.ijser.org
International Journal of Scientific & Engineering Research, Volume 5, Issue 1, January-2014 33
ISSN 2229-5518
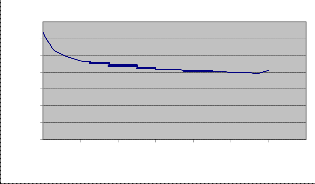
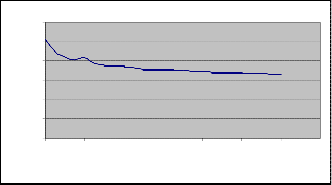
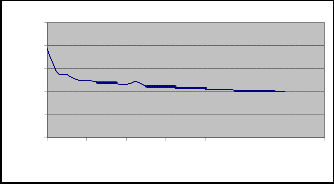
Particulars of experiment:
Reading interval: 30 sec; Specimen width: 1 inch; Gauge length: 8.0 inches.
140
120
100
80
60
40
20
0
0 2 4 6 8 10 12 14
Time in minutes
300
250
200
150
100
50
0
0 2 4 6 8 10 12 14
Time in minutes
![]()
Fig. 4. Time Stress Curve: Sample No. 1 – 50 gsm Fig. 5. Time Stress Curve: Sample No. 2-60 gsm
300
250
200
150
100
50
0
250
200
150
100
50
0
0 2 4 6 8 10 12 14
Time in minutes
0 2 4 6 8 10 12 14
Time in minutes
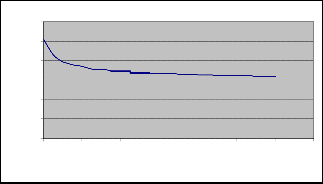
Fig. 6. Time Stress Curve: Sample No. 3 – 70 gsm Fig. 7. Time Stress Curve: Sample No. 4 – 80 gsm
180
160
140
120
100
80
60
40
20
0
0 2 4 6 8 10 12 14
Time in minutes
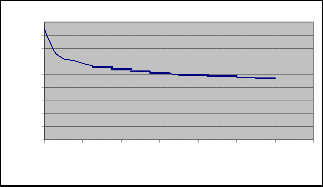
Fig. 8. Time Stress Curve: Sample No. 5 – 90 gsm
IJSER © 2014 http://www.ijser.org
International Journal of Scientific & Engineering Research, Volume 5, Issue 1, January-2014 34
ISSN 2229-5518
TABLE 2
EXPERIMENTAL RESULTS OF STRESS RELAXATION V/S TIME
![]()
![]()
(Minutes) Sample1 Sample2 Sample 3 Sample 4 Sample5 (50 gsm) (60 gsm) ( 70 gsm) (80 gsm) (90 gsm)
1 0 127.500 255.000 255.000 193.750 170.000![]()
![]()
2 0.5 108.125 222.500 216.125 141.500 136.120![]()
3 1.0 101.250 209.250 197.625 137.750 124.000
4 1.5 97.375 202.375 190.250 126.250 121.125![]()
![]()
5 2.0 94.000 209.000 185.250 124.250 116.750
6 2.5 92.750 192.375 178.000 121.500 113.750![]()
![]()
7 3.0 91.250 189.000 177.500 120.620 111.500
8 3.5 89.375 186.250 175.000 117.750 109.875![]()
![]()
9 4.0 88.000 183.750 171.875 115.500 107.750
10 4.5 87.375 181.250 170.500 121.120 106.250![]()
![]()
11 5.0 I85.J500 S179.000 E168.750 R113.000 1 05.000
12 5.5 84.875 177.750 167.625 111.750 104.000
13 6.0 83.750 176.750 166.875 110.500 102.500
14 6.5 83.125 175.000 166.125 109.870 101.750
15 7.0 82.750 173.750 165.250 108.750 100.250![]()
16 7.5 82.375 173.000 164.500 107.750 99.875![]()
17 8.0 81.875 171.750 163.750 106.750 98.625
18 8.5 81.250 170.625 162.875 105.250 98.000![]()
![]()
19 9.0 80.625 170.000 162.125 104.370 97.375![]()
20 9.5 80.500 168.750 161.375 103.750 96.500
21 10.0 80.000 167.750 160.875 103.120 96.125![]()
![]()
22 10.5 79.875 166.750 160.375 102.500 95.500
23 11.0 79.375 166.500 159.750 101.500 94.375![]()
![]()
24 11.5 78.750 165.625 159.375 100.250 94.000![]()
25 12.0 82.375 164.875 158.875 100.000 93.625![]()
IJSER © 2014 http://www.ijser.org
International Journal of Scientific & Engineering Research, Volume 5, Issue 1, January-2014 35
ISSN 2229-5518
The experimental analysis reveals that nonwoven textiles do possess the inherent characteristic of minimizing the stress generated in them owing to the application of an external load on them. The results show that as time passes with the application of an applied load on the specimens, the stress starts to decay very rapidly in the initial stages and subsequently the rate of decay becomes gradual over a certain period of time, and ultimately reaches an equilibrium state after which no further decay in the stress levels is observed.
The amount of residual stress at this equilibrium stage is different for different specimens. The amount of relaxation can be indicated in terms of percentage of relaxation and it can be very well observed from the experimental results that different specimens exhibit different relaxation percentage. This can be attributed to various factor viz. the specimen composition, structure, type of bondage etc. This can also be attributed to the varying gsm values of the different specimens selected for the test.
[6] C.S. Rangan, G.R.Sharma and S.V.Mani 1990, Instrumentation
Devices and Systems, pp. 32 – 46.
[8] E.K.Bayrakar and A.S.Hockenberger, Medical Textiles.
[9] Journal of Applied Polymer Science 1992, Vol. 45, pp. 253 – 263.
The nonwoven samples with a higher gsm value have exhibited a better relaxation of stress as is evident from the results. This understanding of the relexation behavior of textile materials in very important when they are put to use for applications wherein they are subjected to a constant external load. It makes us to know in what way a given textile material is capable of overcoming the applied stress.
The author express his gratitude to Mr. Muluken Masresha, Scientific Director, Kombolcha Institute of Technology (KIOT), Wollo University, for his motivation and guidance. He also extends his thankfulness to the staff of Textile Engineering Department, KIOT, Wollo University for their encouragement and support.
[1] Leaderman.H. 1943, Elastic & Creep Properties of Filamentous Materials & other High Polymers, The Textile Foundation Wahington D.C, USA.
[2] Morton A.J.P. and Hearle J.W.S. 1975, Physical Properties of
Textile Fibres, The Textile Institute, Manchester.
[3] Sawhney. A.K. 1995, Electrical and Electronic Measurements and
Instrumentation.
[4] Textile Research Journal 1991, Vol. 61(6), pp. 363 – 369. [5] Journal of Textile Institute 1995, Vol. 86, pp. 10-19.
IJSER © 2014 http://www.ijser.org