International Journal of Scientific & Engineering Research, Volume 6, Issue 4, April-2015
ISSN 2229-5518
288
Rabi Narayan Panda1, Mirza Ashad Baig2, Dr. Bijay Ketan Panigrahi3, Dr. Manas Ranjan Patro4,
Abstract— Computer Aided Diagnosis (CAD) has drawn significant attention in the area of medical science as it has brought a paradigm shift in the areas of medical Imaging and Analysis and has a demonstrated potential for increasing survival rates by early detection of intangible malignant tumors and small lesions. A Digitized Mammogram usually contains non resourceful information such as x-ray annotations, noise due to the presence of pectoral muscle in the vicinity of region of interest (ROI). This paper instigates in increasing the quality of evaluation data. This paper thus focuses on implementing clustering method for identifying suspected clusters in digitized mammograms taken from publicly available MIAS database after removal of unwanted noise , so that the proportion of true data exceeds that of false data.So CAD assistance with subjective analysis devises an effective method to eradicate human errors by providing a second opinion diagnosis and improve the accuracy and reduce false positive cases.
Index Terms— Clustering Method, Intensity Adjustment, Mammograms, Pectoral Muscle Removal, X-Ray Annotation Removal, .
—————————— ——————————
Although Early detection is a key factor to the success of treatment process. Survey from National Cancer Institute’s , published by American cancer society i[1] shows that there are nearly 100 % of patients who have survived if diagnosed in the early stage of cancer that is Stage 0 and Stage I while the rate decreases to 73 % incase diagnosed at stage II and nearly
22% if detected at stage IV. So the important part for radiolo- gist and researchers has been diagnosing the cancer at the ear- lier stages. Breast Cancer has been the second most common cancer overall ii[2] with Belgium having the highest rate of breast cancer, followed by Denmark and France. Breast cancer has also been observed in men, iii[3] .In 2011 ,20,097 women and 2,078 men in the United States were diagnosed with breast cancer iv[4] and 40,931 women and 443 men died from breast cancer. So 0.3 per 100,000 and 21.5 per 100,000 deaths have been observed for men and women respectively. Though Survival rates for men are about the same as for women if di- agnosed at similar stage, but generally, men are usually diag- nosed at a later stage.
Mammography has been widely accepted method to screen breast cancer. Various observations are carried out by radiologist and it has been estimated that sensitivity of screening is about 75% v[5]. The current methods adopted by different countries are ‘single reading by
————————————————
1 Working as Associate Professor in Department of MCA at Krishna Institute of Engineering and Technology Ghaziabad, Uttar Pradesh, India ,
E-mail: rabipanda@rediffmail.com
2. Mirza Ashad Baig is currently persuing his Btech at Babu Banarasi
Das National Institute of Technology and Management, Lucknow.
E-mail: baigashad@gmail.com
3. Dr. Bijay Ketan Panigrahi is working as a Associate Professor in
Department of Electrical Engineeringat Indian Institute of Technology,
Delhi, India.E-mail: bkpanigrahi@ee.iitd.ac.in
4. Dr. Manas Ranjan Patro is Professor in Department of Computer
Science at Berhampur University,Berhampur, India.
Email: rpatra12@gmail.com
United States, and most of the European countries follow the double reading as their standard vi[6]. Studies have shown that breast cancer detection rate using single reading and double reading are same without computer assistance vii[6] In a similar study subjects undergoing routine screening were randomly selected in England at three different centers and were assigned for single ,double readings. The double reading gave 87.7% and single reading gave around
87.2%[6] which meant the approach with single reading and CAD involved would erase human errors . So CAD assistance with subjec- tive analysis is an effective method to eradicate human errors by providing a second opinion diagnosis and improve the accuracy and reduce the false positive cases. High true positive rates can be achieved with the accuracy of image segmentation. As there cannot be a specific value set to measure the accuracy of segmentation, which iterates there would not be any guarantee for overall CAD systems. So if the segmentation accuracy can be termed into three categories with good, average and bad, where bad leads to high false positive cases it could lead to better a classification and sorting of
relevant data. Catarious et al viii [7] proposed a method based on
Catarious Segmentation which uses Fisher’s Linear Discriminant Analysis (LDA) and performs thresholding to categorize pixels in- side the mass area and outside , the main ineffectiveness of this me- thod was observed in low contrasted images where the algorithm counts background pixel as lesion. Sahiner et al.ix[8] proposed a method based on transformation which is Rubber Band Straighten- ing Transform (RBST) , here features were derived but the draw back was the algorithm was vulnerable to noise if the borders were not defined . Sethian x[9] proposed a method based on marching method which is related to active contour models which is one of the most popular method for medical image analysis but this method produced results which were less effective due to the noisy nature of mammogram images. Leventon et al xi[10] proposed a method based on Principal Component Analysis (PCA) which is based on shape priors. But the algorithm fails to make an impact because lesions or
tumors do not have a predefined shape. Leonardo de Oliveira
IJSER © 2015 http://www.ijser.org
International Journal of Scientific & Engineering Research, Volume 6, Issue 4, April-2015
ISSN 2229-5518
289
Martins et al [11] proposed a method based on K-means algorithm for segmentation and Grey Level Co-Occurrence Matrix (GLCM) to describe the texture of segmented structures,the results showed high sensitivity towards false positive cases . In this study we propose a novel level set based on K-means Clustering method designed for identifying clusters in the mammogram image which would be sus- pected suspicion and the derived clusters will be trained so that their statistical features are derived, though this study concentrates more on removing the pectoral muscles and finding suspected clusters in the image lesions in digital mammograms.
2. Methodology
The proposed segmentation algorithm provides qualitative and quan- titative results to its preceding method provided by Leonardo de Oli- veira Martins et al. as it allows the user to analyze all the suspected clusters. The first step is preparing the image database, for this work we have used publicly available MIAS database after which we adapt our segmentation algorithm. Before segmentation algorithms can be applied for the task, mammograms need to be pre-processed which includes pre-processing such as noise removal, artifact sup- pression if found any and the most important is pectoral muscle re- moval which has the major influence in ineffectiveness of segmenta- tion. The methodology contains 4 components :A) Intensity Adjust- ment of the digitized Mammogram B) X-Ray Annotation (label re- moval) C) Pectoral Muscle Removal D) Estimating clusters
The presented system algorithm is developed using Matlab®.
The original image taken from the database has to be pre- processed before applying the segmentation algorithm .Figure
1(a) & (b) shows the original image and its contour by apply- ing Seed Region Growing Algorithm (SRGA) xii [12] where it can be observed that pectoral muscles depicted in white inten- sity has to be removed inorder to give an effective area for cluster estimation. Image enhancement techniques has been employed before pectoral removal , where "improve" is de- fined objectively . Figure 2(a) shows the histogram of original Image and Figure2(b) that of enhanced image .
The next most important step would be removing label which will be present on the x-ray data as an identification mark, As manual crop- ping of label is generally not appreciated so an effective label re- moval algorithm is necessary and as shown in figure 1(b) the intensi- ty level of label area generally co-insides with the pectoral muscle, The implemented algorithm should be effective enough to differen- tiate between label and pectoral muscle. The Histogram equalized image is subjected to contrast adjustment and an adaptive threshold- ing method is applied where histogram and probabilities of each intensity level are computed and there weighted average is taken as shown in Eq(1) and then all possible thresholds from 1 to maxi- mum intensity is taken as shown in Eq(2) and Eq(3) and desired threshold is obtained ,then average threshold for two cases;one from the center of histogram to left and other from center to right of histo- gram is taken and then once thresholding is performed blobs present in image are identified . The largest blob is identified and morpholo- gy operation is performed. Only true pixel value covering largest blob area is retained and other features are discarded from original image to retain an image without annotation as shown in Figure 3.
(t)
w1 (t) 1
(t)
w2 (t) 2
(t )
- (1)![]()
t p i ti f t t rated by a threshold and variances of these classes.
t
w1 (t ) p(i)
0
- (2)
Wile the class mean (t)
1
is:
![]()
t
(t ) p(i) x(i) w1
- (3)
0
where x(i) is the value at the center of the ![]() th histogram
th histogram
bin.
IJSER © 2015 http://www.ijser.org
International Journal of Scientific & Engineering Research, Volume 6, Issue 4, April-2015
ISSN 2229-5518
290
(a) (b)
Figure 1: (a) Original Image (b) Mammogram visualized with SRGA
2.3 Eliminating Pectoral muscle
First step towards eliminating pectoral muscle is finding whether the image is RMLO or LMLO and in case it is a Left oriented image we change the orientation towards right and align it properly then will help in removing pectoral muscle easier as pectoral muscles are ho- mogeneous and located on the left top. So first we determine the breast skin line . This knowledge of breast line and the location of pectoral muscles makes detection relatively easier. Mostly pectoral muscles in the intensity scale of bright to dark fall into the range of bright pixels , So pectoral muscles which are brighter are usually easier to be distinguished . The first step is to determine the region of interest which is finding the breast outline which is determined by
the change in variation from white pixel to black pixel where pector-
2.4 Estimating clusters
Clustering algorithms works on the principle that if region or pixel belongs to one object then an interactive method is performed which decides if each neighboring pixel belongs to the same object or not by which clusters are formed . As per the cancerous tumor tissue the neighboring tissue properties are generally the same and hence there pixel properties would also be similar . The method is clustering of all objects into small distinct groups centroids are defined, for each group. A property region for each centroid is defined which has a set of similar areas. This process will be a interactive process where each group is recalculated to minimize functions which is calculate by equation (4).
al muscle is situated. Outline will be seen of two kinds one is curved and other is straight. Filling the region inside it with maximum inten- sity values will define the exact area to be used for segmentation, for
J
![]()
( j )
i
![]()
2
c j
(4)
the k-means algorithm. So once the ROI is defined, for initial thre- sholding we divide mean intensity value of the ROI with 1.5. the important consideration here is there should not be any back ground pixels which in other words means that mean value is the actual mean value of the breast tissue which includes pectoral muscle . Once we have found the mean value based on the fact that the pec- toral muscles have a brighter intensity value the mean value is sub- tracted from max value and also from minimum value to get two sets of thresholds which is used to detect pectoral muscle
Where there are k clusters in xj and j is 1,2,3...k and cj is the centroid
of all the points. The algorithm for First we Compute the intensity
variation by histogram method using MATLAB’s inbuilt function , then centroids with k random intensities are initialized using equa- tion (5) and steps are repeated until the cluster labels of image does not vary. Then finally we cluster the points based on the distance from centroid from equation (6)
IJSER © 2015 http://www.ijser.org
International Journal of Scientific & Engineering Research, Volume 6, Issue 4, April-2015
ISSN 2229-5518
291
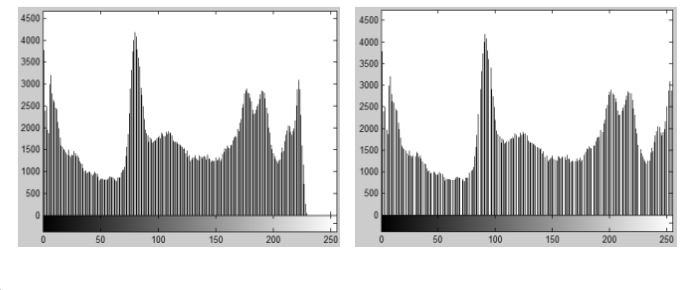
Figure 2: Histogram (a) Original Image (b) Processed image
C arg min j
![]()
![]()
2 (i )
j
(5)
3. RESULTS AND DISCUSSIONS
m
1{ci
j} x
Finding an automated algorithm capable of segmenting the breast region in mammograms has proven to be a difficult task. We have
i 1
j m
(6)
approached the problem from a morphological image processing and cluster segmentation method perspective .There are two key contri-
1{ci j}
i 1
Where k is the parameter of the algorithm (the number of clus- ters to be found), j iterates over the all intensities, j iterates over all the centroids and are the centroid intensities
Figure 3: Image Annotation removed
butions of the work presented in this paper the first of these is a fully automated segmentation to remove x-ray annotation and pectoral
muscles where the algorithm has been tested for different type of
background like fatty and fatty-glandular, The stages of pectoral removal is shown in Figure 4.
The second contribution isof the cluster algorithm for find- ing clusters .This algorithm has been tested using mammogram im- ages on different class of abnormality present that is calcification circumscribed masses, speculated masses, architectural distorted data for testing the performance of cluster algorithm. The algorithm was tested on 36 data sets from the MIAS database where as the results for one of the image is shown in Figure 5 . Some of the sets con- tained more than one possible mass region.. In the 36 images there were 39 possible mass regions. The algorithm was able to indicated
100% efficiency for x-ray annotation and 34 of 36 sets that is 94.4 efficiency was observed for pectoral muscle segmentation and clus- ter algorithm gave an efficiency of 32 against 36 test data bringing an efficiency of 88.9.
IJSER © 2015 http://www.ijser.org


IJSER © 2015 http://www.ijser.org
(a) (b) (c) (d)
Figure 4: Stages of pectoral muscle removal (a) detecting boundary (b) Finding the inside region (c) finding the pectoral muscle (d) Output image after removing pectoral muscle
(a) (b) (c)
Figure 5 : CLUSTER OUTPUT (a) Input Image (b)clustered image (c) Resulting Image with inverted output
4. CONCLUSION
Discarding pectoral muscles ,removing x-ray annotation and seg- menting the digitized mammogramfor further feature extraction is the first step presented in this paper. The results obtained are compa- rable and this work is the initial part of the CAD system where fu- ture work will involve extracting textural features from the seg- mented image and then training the classifier to make an automated detection system for normal, benign or malignant and creating a window for Double reading through CAD system.
The efficiency of the segmentation algorithm depends on how well the pectoral muscles are eliminated .Figure 4 depicts different stages of pectoral muscle removal According to our results, the proposed- segmentation method provides acceptable level of segmentation accuracy with an overall accuracy of 86.85%, offering a highly accu- ratesegmentation stage for a CAD system. The developed segmenta- tionmethod can be applied for treatment planning and disease cause detection.
International Journal of Scientific & Engineering Research, Volume 6, Issue 4, April-2015
ISSN 2229-5518
293
[1] Detailed Guide on Breast Cancer Breast Cancer Survival by stage ,American Cancer Society[Online resources] . Ac- cessedon 08/12/2014, Available at http://www.cancer.org/cancer/breastcancer/detailedgui de/breast-cancer-survival-by-stage
[2] Ferlay J, Soerjomataram I, Ervik M, Dikshit R, Eser S, Mathers
C, Rebelo M, Parkin DM, Forman D, Bray, F. GLOBOCAN
2012 v1.0, Cancer Incidence and Mortality Worldwide: IARC CancerBase No. 11 Lyon, France: International Agency for Re- search on Cancer; 2013. [Online resource]. Accessed on
11/12/2014.Available at http://globocan.iarc.fr,
[3] Suan G KOmen, Breast cancer statistics, [Online resources].
Accessed on 22/01/15, Available at
http://ww5.komen.org/BreastCancer/Statistics.html
[4] U.S. Cancer Statistics Working Group. United States Cancer Statistics: 1999–2011 Incidence and Mortali- ty Web-based Report. Atlanta (GA): Department of Health and Human Services, Centers for Disease Control and Prevention, and National Cancer Insti- tute;2014.Availableat :
http://www.cdc.gov/cancer/breast/statistics/
[5] Nagi, J.; Abdul Kareem, S.; Nagi, F.; Ahmed, S.K., "Automated breast profile segmentation for ROI detection using digital mammograms," Biomedical Engineering and Sciences (IECBES), 2010 IEEE EMBS Conference on , vol., no., pp.87,92, Nov. 30 2010-Dec. 2 2010
[6] Gilbert, F., Astley, S., Gillan, M., Agbaje, O.F., Wallis, M.G.,
James, J., Boggis, C.R.,Duffy, S.W, Single reading with com- puter-aided detection for screening mammography. “New Eng- land Journal of Medicine”, 1675–1684. 2008.
[7] Catarious, D.M., Baydush, A.H., Floyd Jr., C.E. Incorporation of an iterative, linear segmentation routine into a mammographic mass CAD system.” Journal of Medical Physics “Vol 31 (6),
1512–1520. 2004
[8] Sahiner, B., Chan, H.-P., Petrick, N., Helvie, M.A., Goodsitt, M.M. Computerized characterization of masses on mammo- grams: the rubber band straightening transform and texture analysis. ‘Journal of Medical Physics’ ,vol 25 (4), pp- 516–526.
1998
[9] Sethian, J.A.. Level set methods and fast marching methods: evolving interfaces in computational geometry, fluid mechanics, “Computer Vision, and Materials Science’, 2nd ed. Cambridge University Press, Cambridge, UK (Chapter 10),2002.
[10] Leventon, M.E., Grimson, W.E.L., Faugeras, O.’Statistical shape influence in geodesic active contours. Computer Vision and Pattern Recognition’, pp 316– 323, 2000.
[11] Leonardo de Oliveira Martins, Geraldo Braz Junior, Aristofanes
Corr ´ ea Silva , Anselmo Cardoso de Paiva, and Marcelo Gat-
tass, ‘Image Analysis Detection of Masses in Digital Mammo-
grams using K-means and Support Vector Machine’. Electronic
Letters on Computer Vision ‘,vol8 (2):39-50, 2009
![]()
[12] Octavio Gómez, Jesús A. González, Eduardo F. Morales, Image Segmentation Using Automatic Seeded Region Growing and In- stance-Based Learning ,’Progress in Pattern Recognition, Im- age Analysis and Applications Lecture Notes in Computer Science, Volume 4756, pp 192-201 ,2007.
IJSER © 2015 http://www.ijser.org