International Journal of Scientific & Engineering Research, Volume 5, Issue 12, December-2014
ISSN 2229-5518
1379
An Automatic Infant’s Cry Detection Using Linear
Frequency Cepstrum Coefficients (LFCC)
Miss Varsharani V Bhagatpatil, Prof.V.M.Sardar
Abstract—In this paper, we mainly focused on automation of Infant’s Cry. For this implementation we use LFCC for feature extraction and VQ code- book for matching samples using LBG algorithm. The baby crying samples collected from various crying baby having 0-6months age. There are 150 baby’s sound as training data, each of which represents the 30 hungry infant cries, 30 sleepy infant cries, 30 wanted to burp infant cries, 30 in pain infant cries, and 30 uncomfortable infant cries (could be because his/her diaper is wet/too hot/cold air or anything else).The testi ng data is 40, respectively 8 infant cries for each type of infant cry. The identification of infant cries based the minimum distance of Euclidean distance. The, classification of the cry in five classes neh – hunger owh – sleepy, heh – discomfort ,eair – lower gas, eh – burp.
Here for classification of the cry our system is divided into two phases. First, in training phase, in which LFCC is applied for feature extraction, and then VQ codebooks are generated to compress the feature vectors. Second, is the testing phase in which features extraction and cod ebook generation of samples are repeated. Here, comparison of the codebook template of samples to the all the available templates in the database are carried based on Euclidian distance between them. LFCC effectively capture the lower as well as higher frequency characteristics than MFCC, hence we will get good results over MFCC.
Index Terms—DBL, LFCC, Feature extraction, Euclidean distance, Matlab, VQ,LBG.
1 INTRODUCTION
The first verbal communication of newborn baby with the world is baby’s cry. Infant crying is a biological alarm sys- tem. An infant crying signal is the attention call for parents or caregivers and motivates them to alleviate the distress. Currently, there is a system that learns the meaning of a 0-3 month old infant cries which is called Dunstan Baby Lan- guage (DBL). DBL is introduced by Priscilla Dunstan, an Australian musician who has got talent to remember all kinds of sounds, known as sound photograph. According to DBL version, there are five baby languages: “neh” means hunger, “owh” means tired which indicates that the baby is getting sleepy, “eh” means the baby wants to burp, “eairh” means pain (wind) in the stomach, and “heh” means un- comfortable (could be due to a wet diaper, too hot or cold air, or anything else).
Infant crying is characterized by its periodic nature, i.e. al-
ternating cry utterances and inspirations. By using a rapid flow of air through the larynx burst sound is produced, because of that there is repeated opening and closing of the vocal folds, which in turn generates periodic excitation. This excitation is transferred through the vocal tract to pro- duce the cry sound, which normally has a fundamental frequency (pitch) of 250-600 Hz. The acoustic signal of an infant’s cry contains valuable information about their phys- ical and physiological condition, such as health, weight, identity, gender and emotions. Here for cry detection, zero- crossing rate (ZCR) and fundamental frequency [1], Fast
Varsharani V Bhagatpatil is currently pursuing masters degree pro- gram in ENTC Dept in Jayawantrao Sawant College of Engineering, Hadapsar,Pune, India.E-mail: bhagatpatilvv@gmail.com
Prof.V.M.Sardar is currently Head of Department in ENTC Dept in Jayawantrao Sawant College of Engineering, Hadapsar, Pune, In- dia.Also he is pursing PhD in speech from Pune University.
E-mail: vijay.sardar11@gmail.com
Fourier transforms coefficients, were determined and ana- lyzed to detect the crying signals. In clinical settings one can assume noise-free conditions, and the research depends on finding subtle difference between cries that may be used
for diagnostic purposes. In contrast to the clinical settings the detection problem does not assume noise-free condi- tions. In other words, the focus is on robustness in detect- ing crying signals in noisy and unpredictable environ- ments. In this paper, we explain an analysis of infants’ cry and present an algorithm for cry detection, which is aimed to alert parents in potential physical danger situations. The proposed algorithm is based on two main stages. The first stage involves feature extraction using LFCC, in which pitch related parameters, are extracted from the signal. In the second stage, the signal is classified using Vector Quan- tization and later verified as a cry signal. LFCC is based on linear-frequency cepstral coefficients instead of MFCC as a short-time feature. LFCC effectively capture the lower as well as higher frequency characteristics than MFCC [2].Also, mel-frequency cepstral coefficients (MFCCs) and short-time energy were used to develop a noise-robust cry- ing detection system [3]
Motivated by this, we use LFCC for robust performances than MFCC. We hope that, by capturing more spectral de- tails in the high frequency region, the linear scale in fre- quency may provide some advantages in speaker recogni- tion over the mel scale.
2 REVIEWS OF PRIOR CRY DETECTION TECHNIQUES
Researchers did research on infant cries, such as: cries clas- sification of normal and abnormal (hypoxia-oxygen lacks) infant by using a neural network which produces 85% ac- curacy[4], the classification of healthy infants and infants who experienced pain like brain damage, lip cleft palate, hydrocephalus, and sudden infant death syndrome by us- ing Hidden Markov Model (HMM) which produces 91% accuracy. [5]. Previous classification of infant cries studies have used a neural network or HMM as the classifier. The research to identify the DBL infant cries used codebook as a classifier or pattern identifier which is obtained from the k-
IJSER © 2014
http://www.ijser.org
International Journal of Scientific & Engineering Research, Volume 5, Issue 12, December-2014
ISSN 2229-5518
1380
means clustering and MFCC as feature extraction. The choice of the method is based on the high accuracy results from the researches, such as: automatic recognition of bird- songs using MFCC and Vector Quantization (VQ) code- book and produces 85% accuracy [6]. Besides, the research about speaker recognition system also successfully created by using MFCC and VQ [7]. The same research that Singh and Rajan did, got 98. 57% [8] accuracy by doing speaker recognition research using MFCC and VQ. The research about speech recognition and verification using MFCC and VQ which Patel and Prasad (2013) did can do recognition with training error rate about 13% [9]. The making of this codebook using k-means clustering.
3 ANALYSIS OF INFANT CRYING
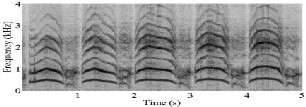
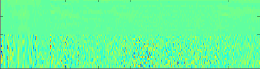
Infant crying signals have the distinct temporal and spec- tral characteristics, which are very important cues in distin- guishing them from general sounds such as speech. Fig.
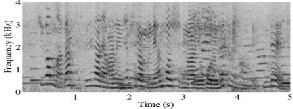
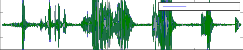
1shows the typical spectrograms of speech and infant cry- ing signal.
(a)
(b)
Fig. 1. Typical examples of spectrograms of (a) speech sig- nal from conversation, (b) infant crying signal.
In general, the speech signals shown in Fig. 1(a) have low
pitch in the range of 100-300 Hz and corresponding clear harmonics in the lower frequency region below 2 kHz, whereas the harmonic structure becomes drastically weaker as the frequency increases. Means, most energy tends to be focused on the lower frequency region, and the transitional patterns of speech are manifold in that region. This is the reason why mel-scale frequency warping is promising for speech recognition [10]. Fig. 1(b) show distinct time- frequency patterns. In general, it has high pitch of about
500 Hz and has duration of about 500- 700 ms. Further, in-
fant crying is characterized by its periodic nature, alternat-
ing crying and inspirations. Also, there are clear harmonic structures and unique melody patterns within the target region. Therefore, characterizing these distinctive and regu- lar patterns is important in effectively detecting the infant crying sounds. In this paper, we employ LFCC to capture the global time-frequency characteristics of infant crying
sounds. In addition, LFCC is proposed to reflect local tran- sitions. Crying signals relatively have mild variations with time. Thus, it is expected that LFCC can provide a better results for infant’s cry.
4 MATERIALS AND METHODS
4.1 Data Collection
The cry signals used in this paper were recorded from the Neonatal Intensive Care Unit (NICU) of Department of Neonatology, Nobal Hospital, and Pune. This cry signals of babies ranging in age between 0 - 9 months. In order to eva- luate the performance of the proposed algorithm in a noisy environment, we used several types of noise, including en- gines, passers-by, motorcycles and speech signals, obtained from several databases.
The data is divided into two, training data and testing data. There are 140 training data, each of which represents the 28
hungry infant cries, 28 sleepy infant cries, 28 wanted to burp infant cries, 28 in pain infant cries, and 28 uncomfort- able infant cries (could be because his diaper is wet/too hot/cold air or anything else). The testing data is 35, respec- tively 7 infant cries for each type of infant cry.
4.2. METHODOLOGY
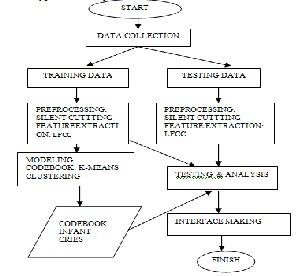
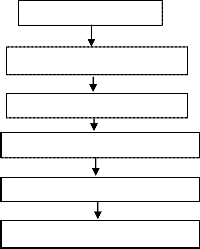
The methodology of this research consists of several stages of process: data collection, preprocessing, codebook model- ing of infant cries, testing and analysis, and interface manu- facturing.The methodology of the infant cries is shown in Figure 2.
.
Figure 2: The methodology of identifying the meaning of a
crying baby.
The methodology consists following steps
Step1: By using LFCC extracting the features from the input
speech samples.
Step2: Training the features and generating the code book of them using Vector Quantization technique.
Step3: Extract the features of test sample and measure the
Euclidian distance to all trained samples in code book.
IJSER © 2014
http://www.ijser.org
International Journal of Scientific & Engineering Research, Volume 5, Issue 12, December-2014
ISSN 2229-5518
1381
Step4: Return the sample as matched sample which is near to the test sample.
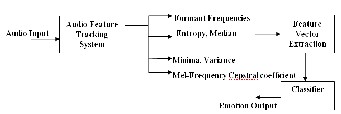
Below is the basic framework of emotion classification.
Fig 3 Framework for Infant’s Emotional Recognition.
4.3 Preprocessing
In preprocessing we remove noises due to engines, pass- ers-by, motorcycles and speech present in the crying sound. LFCC has the narrow banded linear filter-bank. The early reflection in a room impulse response is usually less than 25 ms and it can be captured by the narrow-banded linear fil- ter-bank in the high frequency region and removed through the cepstral mean subtraction, whereas the mel filter bank in the high frequency region is broad-banded and does not have this property.
LFCC is robust in babble noise, but not in the white noise.
The energy in the high frequency region of speech is usual- ly weak and it is more susceptible to noise corruption. LFCC has more filter banks in the high frequency region and this is why it is less robust in the white noise than MFCC.
4.4 LFCC Algorithm
The first step in the implementation of any speech recognition system is extracting the features. There are so many well known algorithms for this purpose. LFCC is an efficient feature extracting algorithm. To extract LFCC, each audio clip is first divided into several segments composed of a fixed number of frames. The segment size is 500 ms, which are typical duration of crying sounds, and the frame size is 25 ms with 50% overlap to reflect time evolutions within the segment. Second, LFCCs are computed in each frame, and the q-th LFCC of the t-th frame is given as fol- lows:
 (1)
(1)
where El,t(b) is the energy of the b-th linear-scale bandpass
filter output of the t-th frame in the l-th long-range fixed
length segment, B is the number of linear-scale bandpass filters, and q is the quefrency index. Next, LFCC can be ob- tained by applying a DCT to a sequence of T successive LFCCs along the time axis within the segment. LFCC ma- trix Cl(q,n) at the l-th segment can be obtained as follows:  (2)
(2)
0≤q<B, 0≤n<T
where n is the index of modulation frequency, and T is the number of frames within the segment and is set to 40. Also, we can combine (1) and (2) to represent LFCC matrix.
Signal Normalization
Compute FFT power spectrum
Compute Autoregressive
Apply DCT and Convert to cepstra
Apply lifter to matrix of cepstra
Calculate the deltas
Figure 4: Flow-chart of LFCC feature Extraction.
4.5. Vector Quantization
Here for Speaker recognition we are comparing an un- known baby sound clip with a set of known sound clip in a database and finding the best matching speaker. Vector quantization (VQ) is a lossy data compression method based on the principle of block coding. Vector quantization is a process of redundancy removal that makes the effective use of nonlinear dependency and dimensionality by com- pression of speech spectral parameters. Generally, the use of vector quantization results in a lower distortion than the use of scalar quantization at the same rate. Vector Quanti- zation is one of the preferred methods to map vast amount of vectors from a space to a predefined number of clusters each of which is defined by its central vectors or centroids. In Vector Quantization a large set of feature vectors are taken and a smaller set of measure vectors is produced which represents the centroids of the distribution.
4.5.1Speaker Database
The first step is to build a speaker database, Cdatabase =
{C1,C2, …,CN} consisting of N codebooks, one for each
speaker in the database. This is done by first converting the raw input signal into a sequence of feature vectors X= {x1,
… , xT }. These feature vectors are clustered into a set of M codewords, C = {c1, …, cM}. The set of codewords is called a codebook. The clustering is done by a clustering algo- rithm, and K-means clustering algorithm is used for this purpose.
4.5.2 K-means
In speech processing K-means algorithm is widely used. “K” is pre-selected and simply refers to the number of de- sired clusters. One way to compute the code vectors of the training set is to start with an arbitrary random initial esti- mate of the code vectors and to apply the nearest neighbor
IJSER © 2014
http://www.ijser.org
International Journal of Scientific & Engineering Research, Volume 5, Issue 12, December-2014
ISSN 2229-5518
1382
condition and the centroid condition iteratively, until a termination criterion is satisfied. The K-means algorithm partitions the X feature vectors into M centroids. The algo- rithm first chooses M cluster centroids among the X feature vectors. Then each feature vector is assigned to the nearest centroid, and the new centroids are calculated. This proce-
dure is continued until a stopping criterion is met, that is
Results of Speaker Recognition: The Recognized Speaker and Trainer 1 Match!
2nd Result displays emotions of IdentifiedBaby: Baby Is Hungry!!!!
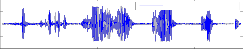
2. Sample Two

1
Original Sound
the mean square error between the feature vectors and the cluster-centroids is below a certain threshold or there is no more change in the cluster-centre assignment.
0.5
0
- 0.5
Original signal
0 5 10 15 20 25 30 35 40

1
0.5
0

Prepr oc essed Sound
Prepr oc essed Signal
- 0.5
0 5 10 15 20 25 30 35 40
Figure 5: K-means with 3 clusters
4.5.3 Speaker Matching
In the recognition phase an unknown speaker, represented by a sequence of feature vectors {x1,…, xT }, is compared with the codebooks in the database. For each codebook a distortion measure is computed, and the speaker with the lowest distortion is chosen. One way to define the distor- tion measure is to use the average of the Euclidean Dis- tances. The Euclidean distance is the ordinary distance be- tween the two points that one would measure with a ruler. Thus, each feature vector in the sequence X is compared with all the codebooks, and the codebook with the mini- mized average distance is chosen to be the best.
5 RESULTS AND DISCUSSION
Considered two samples
1.Sample one
Figure 8: Results after pre-processing of sample two
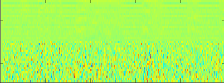
After LFCC
10
20
30
500 1000 1500 2000 2500 3000 3500
Figure 8: Representation of LFCC feature of sample two
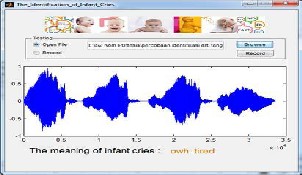
1st Result of Identification of Infant’s cry Displayed:
Results of Speaker Recognition: The Recognized Speaker
and Trainer 12 Match!
2nd Result displays emotions of IdentifiedBaby: Baby Is Sleepy!!!!
1
0.5
0
-0.5
Original Sound
Original signal
-1
0 10 20 30 40 50
Preproc essed Sound
2
1
0
-1
Preproc essed Signal
-2
0 10 20 30 40 50
Figure 6: Results after pre-processing of sample one
After LFCC
10
20
30
500 1000 1500 2000 2500 3000 3500 4000 4500
Figure 7: Representation of LFCC feature of sample one
1st Result of Identification of Infant’s cry Displayed:
Figure 10: The Interface of Identification of Infant Cries
5.1Accuracy Computation
We have computer recognition rate for MFCC and LFCC
with proposed architecture given above.
Recognition_rate = number_of_speech_recognized
/number_of_speech_presented;
From below table 1, it is clearly showing the performance of proposed approach is improved significantly as compared to existing MFCC method.
IJSER © 2014
http://www.ijser.org
International Journal of Scientific & Engineering Research, Volume 5, Issue 12, December-2014
ISSN 2229-5518
1383
6 Conclusion
Table 1: Recognition Rate Performance Analysis
5.2 Results of Classification
This is another major aim of this project; using the fusion of LFCC we achieved the identification of speech disorders. We additionally used the KNN and FFNN for identification and classification purpose.
Following graph in figure 11 is showing the accuracy of
proposed system classification if total numbers of training
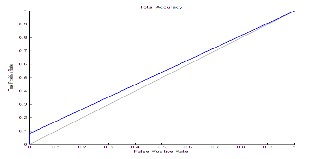
samples are 120 for different emotional cry of different ba- bies.
Figure 11: Accuracy Performance of Proposed System.
Below table 2 is showing the performance of classification for existing and proposed approach.
Number of Training Samples | LFCC | MFCC |
120 | 97.3 % | 93.45 % |
160 | 92.45 % | 83.75 % |
200 | 93.33 % | 80.1 % |
Average Classification Accuracy | 91.02 % | 85.76 % |
Table 2: Performance of Classification Accuracy Using
FFNN Classifier
From above all results, the proposed method improved
performance not only for speaker verification but also for speech disorder detection and classification.
With the helpof Codebook model and LFCC we easily dei- dentified infant’s baby and verified his/her emotions by using KNN with the higher accuracy.The distance using which produce the higher accuracy is euclidean distance. That model can produce accuracy recognition of infant cries with the higher about 94%. The research is just cut the silent at the beginning and at the end of speech signal. Hopefully, in the next research, the silent can be cut in the middle of sound so that it can produce more specific sound. It has impact on the bigger accuracy as well. LFCC resulting higher formant frequencies in speech. LFCC is as robust as MFCC.
Refrences
[1] A. M. Prathibha, R. Putta, H. Srinivas, and S. B. Satish, “An eclec- tic approach for detection of infant cry and wireless monitoring of swinging device as an alternative warning system for physically impaired and better neonatal growth,” World Journal of Science and Technology, vol. 2 no. 5, pp. 62-65, 2012.
[2] X. Zhou, D. Garcia-Romero, R. Duraiswami, C. Espy-Wilson, and
S. Shamma, “Linear versus mel frequency cepstral coefficients for speaker recognition,” in Proc. Autom, Speech Recogn. Under- stand., 2011, pp. 559-564.
[3] R. Cohen, Y. Lavner, “Infant cry analysis and detection,” IEEE
27th Convention of Electrical and Electronics Engineers in Israel,
2012, pp. 1-5.
[4] Poel M, Ekkel T. Analyzing Infant Cries Using a Committee of Neural Networks in order to Detect Hypoxia Related Disorder. International Journal on Artificial Intelligence Tools (IJAIT) Vol.
15, No. 3, 2006, pp. 397-410.
[5] Lederman D, Zmora E, Hauschildt S, Stellzig-Eisenhauer A, Wermke K. 2008. Classification of cries of infants with cleft-palate using parallel hidden Markov models. International Federation for Medical and Biological Engineeering, Vol. 46, 2008, pp. [6]Lee C, Lien C, Huang R. Automatic Recognition of Birdsongs Using Mel-frequency Cepstral Coefficients and Vector Quantization. In- ternational MultiConference
[6] R. M. Gray, ``Vector Quantization,'' IEEE ASSP Magazine, pp. 4--
29, April 1984.
[7] Y. Linde, A. Buzo& R. Gray, “An algorithm for vector quantizer
design”, IEEE Transactions on Communications, Vol. 28, pp.84-
95, 1980.
[8] Mahmoud I. Abdalla and Hanaa S. Ali “Wavelet-Based Mel- Frequency Cepstral Coefficients for Speaker Identification using- Hidden Markov Models”.
[9] X. Zhou, D. Garcia-Romero, R. Duraiswami, C. Espy-Wilson, and S. Shamma, “Linear versus mel frequency cepstral coefficients for speaker recognition,” in Proc. Autom, Speech Recogn. Under- stand., 2011, pp.
IJSER © 2014
http://www.ijser.org