International Journal of Scientific & Engineering Research, Volume 3, Issue 5, May-2012 1
ISSN 2229-5518
An Application of Statistical Thermodynamics to an Open Flow System
Chukwuneke Jeremiah Lekwuwa, Achebe Chinonso Hubert, Okolie Paul Chukwulozie, Ajike Chinagorom Ogbu
Department of Mechanical Engineering,
Nnamdi Azikiwe University, PMB 5025, Awka, Nigeria
Correspondance Email: jl.chukwuneke@unizik.edu.ng
Abstract—This research work, an application of statistical (analytical) thermodynamics to an Open flow system used the grand canonical ensemble to deal with the study of a liquid flow system. The essence was to understand and to interpret measurable macroscopic properties of materials and thus establish valid relationships among measureable variables in a statistical manner over time. A valid relationship with constant, ke between the energy (E) supplied to 2hp pump and the expected discharge (Q) at a 50mm riser was established. This thus reiterates the relationship among important variables for optimal outputs and longevity of the system. Absolute values of energy and the discharge quantities were obtained Eabs = 1305.5122 Joules and Qabs = 0.0095m3/s respectively.
—————————— ——————————
he essential task in this application of statistical
T thermodynamics is to determine the distribution of a
given amount of energy E over N identical systems. The
goal is to understand and to interpret the measurable macroscopic properties of materials in terms of the properties of their constituent particles and the interactions between them. This is done by connecting thermodynamic function to quantum-mechanic equations. Two central quantities in statistical thermodynamics are the Boltzmann factor and the partition factor.
The aim of this research is to statistically collate data of Power (P) developed by the pump, Energy (E) supplied to the fluid by the pump, Discharge (Q) at the riser over
————————————————
![]() Achebe C.H is currently a senior Lecturer in mechanical engineering in
Achebe C.H is currently a senior Lecturer in mechanical engineering in
Nnamdi Azikiwe University, Awka, Nigeria.
![]() Okolie P.C is currently pursuing doctorate degree program in mechanical
Okolie P.C is currently pursuing doctorate degree program in mechanical
engineering in Nnamdi Azikiwe University, Awka, Nigeria.
![]() Ajike C.O is currently pursuing masters degree program in mechanical
Ajike C.O is currently pursuing masters degree program in mechanical
engineering in Nnamdi Azikiwe University, Akwa,Nigeria
different ranges of Voltages (V) available to the pump. Obtaining these values and applying them to the grand
canonical ensemble is intended to ultimately establish a
relationship between the Energy (E) supplied to the fluid
by the pump and the subsequent discharge (Q) at the riser with a possible constant k, thus defining the relationship at any specified value.
The real system adopted for the purpose of this experimental analysis is an integral part of the Water Treatment plant of the Federal Ministry of Works Headquarters, Abuja Nigeria.
This research work adopted a system of 2hp pump to
transport water from the ground tank to an overhead tank. The capacity of the ground tank is 10,000 litres while the overhead tank is 30,000 litres. The two tanks were connected with a riser of 50mm diameter pressurized PVC pipe.
The Headquarter Complex is a three story building with a floor-to-floor distance of 3.5meters. This gives the height of the building from the ground (i.e. height of water to be
transported) to be 3.5 meters X 4 floors (including the
IJSER © 2012 http://www.ijser.org
International Journal of Scientific & Engineering Research, Volume 3, Issue 5, May-2012 2
ISSN 2229-5518
ground floor). Therefore, the height of water to be transported is 14 meters.
The governing equation of the system is the Bernoulli equation which states that “the sum of energy at different points along a cross-section is constant.” Mathematically:![]()
![]()
![]()
![]()
![]() out =
out = ![]()
![]()
![]() in losses ws (1)
in losses ws (1)
Where, P = pressure of the fluid, ![]() = density of the fluid, V = velocity of the fluid, z = height from datum, g = acceleration due to gravity, ws = shaft work done by the fluid per unit mass flowing.
= density of the fluid, V = velocity of the fluid, z = height from datum, g = acceleration due to gravity, ws = shaft work done by the fluid per unit mass flowing.
Another important equation is the one showing the
relationship between Power (P), Discharge (Q), density (![]() ), height (H) and the acceleration due to gravity (g).
), height (H) and the acceleration due to gravity (g).
P = Q. ![]() .g. H (2)
.g. H (2)
If we consider the energy supplied to the fluid per unit time, then Energy (E) supplied to the fluid can be given as:
Energy = (Q. ![]() .g. H) in joule (3) Where, E = energy supplied to the fluid (joule), Q=
.g. H) in joule (3) Where, E = energy supplied to the fluid (joule), Q=
discharge (m3/s), ![]() = density of the fluid (kg/m3), H =
= density of the fluid (kg/m3), H =
Piezometric height of water (meters).
Referring to Eqn. (3) And considering the data obtained from the Water Treatment Plant, as presented in table 1.
S/N | Voltage (Volts) | Power (hp) | Power (Watt) |
1 | 240.00 | 2.00 | 1492.00 |
2 | 238.00 | 2.00 | 1492.00 |
3 | 236.00 | 2.00 | 1492.00 |
4 | 234.00 | 1.90 | 1417.40 |
5 | 232.00 | 1.90 | 1417.40 |
6 | 230.00 | 1.90 | 1417.40 |
7 | 228.00 | 1.80 | 1342.80 |
8 | 226.00 | 1.75 | 1305.50 |
9 | 224.00 | 1.75 | 1305.50 |
10 | 222.00 | 1.70 | 1305.50 |
11 | 220.00 | 1.70 | 1268.20 |
12 | 218.00 | 1.60 | 1193.60 |
13 | 216.00 | 1.60 | 1193.60 |
14 | 214.00 | 1.50 | 1119.00 |
15 | 212.00 | 1.50 | 1119.00 |
16 | 210.00 | 1.50 | 1119.00 |
17 | 208.00 | 0.00 | 0.0000 |
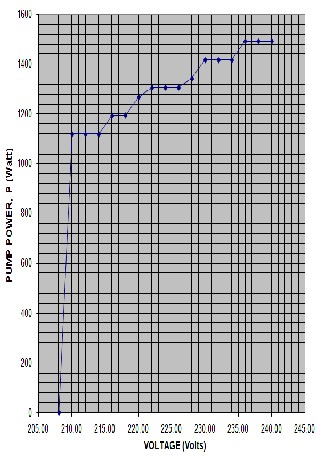
It could be noted that at maximum allowable voltage supply (240volts), the power developed by the pump is
2hp. As the voltage supply is reduced, the power developed by the pump is also reduced until at 208volts the power developed fell to zero. This shows that as the voltage supply reduced below 210volts, the pump could not be actuated hence, no power could be developed as shown on table 1. This relationship is also shown on fig. 1 below.
IJSER © 2012 http://www.ijser.org
International Journal of Scientific & Engineering Research, Volume 3, Issue 5, May-2012 3
ISSN 2229-5518
It could be recalled (from basic assumption) that the time is taken to be unity hence, the numerical value of Power developed by the pump is equal to the Energy supplied to the fluid. The value of the Discharge Q (m3/s), at different values of the voltages (V) supplied to the pump was determined using Eqn. (3).
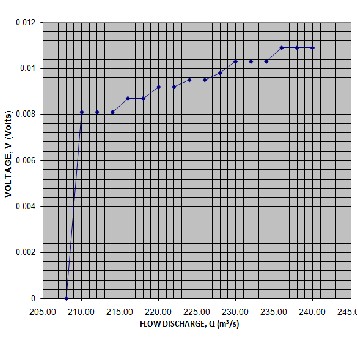
![]() The relationship between Discharge (Q) and the voltage (V)
The relationship between Discharge (Q) and the voltage (V)
is shown on Figure 2.
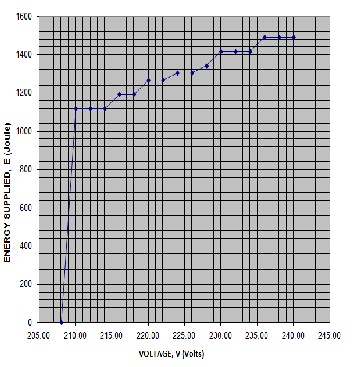
![]() The relationship between Energy (E) and the voltage (V) is shown on Figure 3.
The relationship between Energy (E) and the voltage (V) is shown on Figure 3.
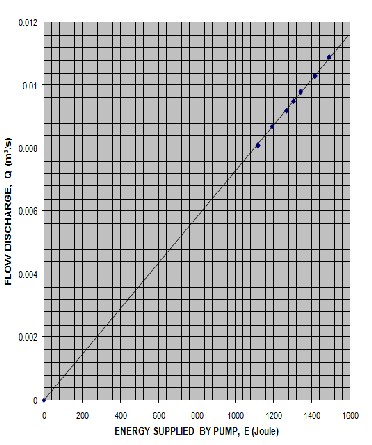
![]() The relationship between Discharge (Q) and the Energy (E)
The relationship between Discharge (Q) and the Energy (E)
is shown on Figure 4.
IJSER © 2012 http://www.ijser.org
International Journal of Scientific & Engineering Research, Volume 3, Issue 5, May-2012 4
ISSN 2229-5518
A numerical computing environment MATLAB (matrix laboratory) was used to obtain the mean (absolute) value of discharge Qabs and the energy Eabs supplied to the fluid. These absolute values are as stated below;
Qabs = 0.009 5 m3/s
Eabs = 1305.512 2 Joule
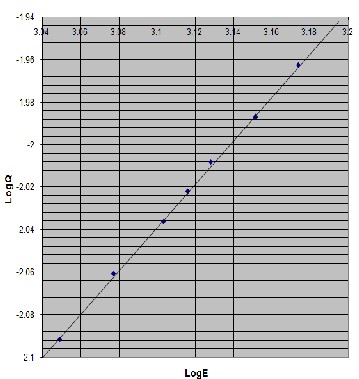
The relationship between the measured and calculated variables is best done from graphs. For the purpose of this research work, the results obtained for the discharge Q and the Energy E are represented on a log – log graph in fig. 5.
IJSER © 2012 http://www.ijser.org
International Journal of Scientific & Engineering Research, Volume 3, Issue 5, May-2012 5
ISSN 2229-5518
Thus, the system can access only those of its macro-state that corresponds to a given value of E of the energy. The equation for the grand canonical ensemble can be represented as [5]:![]()
PV = KBTIn ( (E)) (5) From the foregoing analysis, an equation of the form in eqn
(1.4), using the values of Qabs and Eabs could be obtained.![]()
Since V and T are constant, and assumed unity. Representing PV as the absolute Discharge (Qabs) and In ( (E)) as the absolute Energy, (Eabs) supplied to the fluid. Therefore;
Qabs = KcEabs (6) Where, kc describes the constant that relates Q and E.
From elementary arithmetic, it could be understood that the equation of a straight line is given as; y = mx + c
Where, m = slope of the graph, c = intercept on the log Q axis, y represents the Log Q axis, x represents the Log E axis.![]()
![]()
From Fig. 5, the slope is calculated as: Slope = ![]()
![]()
Therefore, applying the equation of a straight line the
equation becomes: Log Q = 0.235Log E + (-2.1000) Or
Log Q = (0.235Log E) -2.1000 (4)
Equation 4, above has been established as a valid relationship between the amount of energy (E), supplied to the fluid and the discharge (Q) at the riser.
The system described above is an open system or a control volume with exchange of matter. Since the second law of thermodynamics applies to open systems, the Grand canonical ensemble also describes an open system. In Grand canonical ensemble µ, V and T are fixed [4].
Since an open system does not keep a constant energy,
the total amount of energy in the system will fluctuate.
It has been shown on Figure 4, that Q is directly
proportional to E. Since there is a variation, a constant of proportionality must define the relationship. This proportionality constant, kc is gotten from the application of Thermodynamics Ensemble as seen in Eqn. (6).
From Eqn. (6), kc = ![]()
kc = ![]() = 7.3 x 10⁻⁶ m3/Js (constant of proportionality)
= 7.3 x 10⁻⁶ m3/Js (constant of proportionality)
It could be noted that all relations established in this research work are valid only for voltages between 210 to
240 volts supplied to the pump. This is so because this is
the range at which the functionality of the pump can be guaranteed.
This research work has shown the interface between statistical thermodynamics and real system using grand canonical ensemble. It has helped to establish a valid relationship and a constant, kc between the energy (E) supplied to a 2hp pump and the expected discharge (Q) at the 50mm riser. This modern research techniques and challenges abound in research work.
[1] Cengel Y.A., Boles M.A. (2007). Thermodynamics: an Engineering Approach (Sixth Edition ed.). McGraw Hill. p.141.
[2] Goodstein, David (1985). “Critical Phenomena and phase Transitions”. States of Matter (1st ed.).
IJSER © 2012 http://www.ijser.org
International Journal of Scientific & Engineering Research, Volume 3, Issue 5, May-2012 6
ISSN 2229-5518
Toronto, Canada: General Publishing Company,
Ltd. p.452.
[3] J. de Boer, (1948). “Quantum theory of condensed permanent gases I the law of corresponding states”. Physica (Utrecht, Netherlands: Elsevier) 14:
139-148.doi:10.1016/0031-8914(48)90032-9.
[4] Nash, Leonard K. (1974). Elements of Statistical
Thrermodynamics. Dover Publications, Inc.
[5] Schrodiner, Erwin (1946). Statistical
Thermodynamics. Dover Publications, Inc.
[6] Tester, Jefferson W. and Modell, Michael (1997).
Thermodynamics and its applications. Prentice
Hall.
[7] Water Treatment Plant Statistics, (2010). Federal
Ministry of Works, Headquarter, Abuja Nigeria.
IJSER © 2012 http://www.ijser.org