International Journal of Scientific & Engineering Research, Volume 4, Issue 4, April-2013 1167
ISSN 2229-5518
Algorithm for the Detection of Microcalcification in Mammogram on an Embedded Platform
Bibin Binu Simon1, Vinu Thomas2
Jagadeesh Kumar P3
1 Asst: Professor,Dept of ECE Mangalam college of Engineering, Kottayam,bibinbinu88@gmail.com
2 Assoc: Professor,Dept of Electronics ,College of Engineering,Chertala
3 Asst: Professor,Dept of Electronics ,Model Engineering College, Cochin
Abstract— Breast cancer incidence varies across countries, but in most cases this type of cancer is the second cause of death for the female popul a- tion. The existing technology for early detection of breast cancer is the mammography, which outperforms a uto-exploration and manual exploration by the specialist. It is estimated that the actual prevention by screening programs fails to detect around 25% of the cancer that are visible in a retrospective analysis .Screening programs have draw backs like high cost, inexpert radi ologist and visual fatique.Digital Mammographic machines are common now a days which captures the photographic image of the suspected breast and with the help of a computer aided tool ,the result is predicted by the radiologist. Inexpert and careless radiologist may misinterpret the result and increases the number of false positive and false negative. Portability is also an issue.Incorparating an embedded system to the existing mammographic machine may avoid these risks. Micro calcifications are tiny calcium deposits, present in 30-50 % of all cancer found mammographically.However 10- 30 % of the microcalcifica- tions are missed by radiologist .Detection of micro calcification is an area of scope and resarch.The text ure and shape of these increases its detection risk. Designing an Embedded system for its detection is also a challenge.The paper describes a method for the efficient d etection of microcalcification in mammogram.
Index Terms— Micro calcifications, NonsubsampledContourlet Transform, Artificial Neural Network, Probabilistic Neural Network, MIAS Database.
1 INTRODUCTION
—————————— ——————————
Breast cancer is the most common cancer among women. It is the second most cause of death in women after Lung Cancer. The current statistics of women with breast- cancer is quite surprising. About 1 in 8 U.S.A Women,(just under 12%) will develop invasive breast cancer over the course of her lifetime. Mammography is the process of using low-energy-X-rays (usually around 30 kVp) to examine the human breast and is used as a diagnostic and a screening tool. The goal of mammography is the early detection of breast can- cer, typically through detection of characteristic masses and/or microcalcification . Most doctors believe that mam- mography reduces deaths from breast cancer. Often women are quite distressed to be called back for a diagnostic mam- mogram. Most of these recalls will be false positive results. Calcifications are tiny specks of mineral deposits (calcium oxa- late dihydrate, calcium hydroxyapatite)[22], that can be scat- tered throughout the mammary gland, or occur in clusters. When found on a mammogram, a radiologist will then decide whether the specks are of concern. Normally a computer aided tool (CAD) is used for the the de- tection of
microcalcification in mammograms. This approach suffers from some limitations such as portability , lack of skilled tech- nicians to operate with the tool etc. These problems can be eliminated by the use of an embedded system, which can au- tomatically detect the microcalcification in a given area , and predict its occurrence. The NonsubsampledContourlet Trans- form can effectively capture the contours in the image .The Probabilistic Neural Network is also known for its high detec- tion rate. Incorporating the algorithms can lead to a high de- tection rate.
2 PREVIOUS RESEARCH AND HYPOTHESES
On moving through the literatures we can find a
number of approaches for the automatic detection of μCa
++ in mammograms .Among them comes the application
of wavelet transform . Detection of micro calcification by
undecimated wavelet transform involving Gaussian assump-
tions and methods derived to overcome the limitations of
those assumptions were proposed for the detection of
microcalcification in mammograms[5].Also Wavelet based
subtraction techniques for the elimination of dense breast
tissues, elimination of connective tissues using appropri- ate technique and classification using an appropriate network are also proposed[12]. Proposals in which applica-
tion of wavelet transform and there after the elimination of the low frequency subbands is a typical approach
.The resulting subband coefficients if reconstructed back resulted in the microcalcification enhanced image[2]. Prepro- cessing of the signals such as segmentation ,masking
,histogram modifications incorporated with DWT ,have also
been developed which help, to detect the presence of μCa
++ in human breast. Extraction of the characteristics of
the microcalcification based on wavelet transform and utiliz-
ing various feature reduction techniques are also under inves- tigation. Various methods in which detection of microcalcifica- tion using difference image technique in which a signal suppressed image is subtracted from a signal enhanced
image to remove the structural background in mammo- grams have given satisfactory results. Incorporating the con- cepts of fractal modeling and the difference techniques have
IJSER © 2013
http://www.ijser.org
International Journal of Scientific & Engineering Research, Volume 4, Issue 4, April-2013 1168
ISSN 2229-5518
also proven excellent results[4].Various methodologies in ad- dition to the previously mentioned methods have also b proposed such as the Fuzzy-Neural and feature ex
tion techniques[1].Various Methods in which a random se for the abrupth change in the intensity value is a com method that was employed. Comparative studies bet the different feature extraction methodologies have been exploited through a neural based approach. proaches based on fuzzy logic techniques and morphol
have also been studied by personals across the globe. Various other approaches based on Markov random field,SVM are also under investigation.
While investigating through the literature , we can find that there are numerous number of approaches
indeed very difficult to point out every approac The major disadvantage of all these approaches i lack in capturing the significant information.
The techniques which help us to addres are discussed:
3.1 Contourlet Transforn [7]
An efficient transform captures the essen en signal or a family of signals with few basis fun
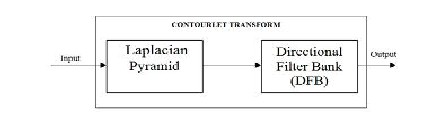
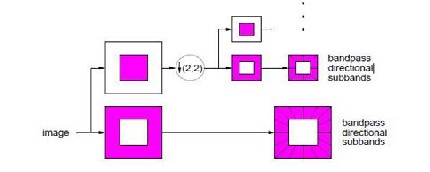
set of basis functions completely characterizes the transform and this set can be redundant or not, depending on whether the basis functions are linear dependent. By allowing redun- dancy it is possible to enrich the set of basis functions so that the representation is more efficient in capturing signal behavior. In addition redundant representations are more flexible and easier to design. In applications such as denoising, enhancement, and contour detection a redundant representation can significantly outperform a non redundant one. Another importance of a transform is stability with re- spect to shifts of input signal. Due to shift variance small change in input image create unpredictable change in ener- gy distribution of detail image pixels. This in turn may lead to large distortion in output. Pyramidal filter bank structure of the contourlet transform has very little redundancy, which is important for image compression applications. However designing good filters for contourlet transform is a difficult task. In addition contourlet transform is not shift invariant. NSCT is motivated to be employed in some appli- cations where redundancy is not a major issue. NSCT is fully shift-invariant, multiscale and multidirection expan- sion that has fast implementation. Design problem is less con- strained than that of contourlets. This enables to design fil- ters with much selectivity there by achieving better subband decomposition. In contrast with contourlet transform non- subsampled directional pyramid structure and nonsubsam- pled directional filter banks are employed in NSCT. The non- subsampled pyramid structure is achieved by using two channel nonsubsampled 2D filter banks. The DFB is achieved by switching off the downsamplers and upsam- plers in each two channel filter bank in DFB and upsampling the filters accordingly .
Fig 3.11:The block diagram of Contourlet transforms.[7]
Fig 3.12: Decomposition frame work of CT[7]
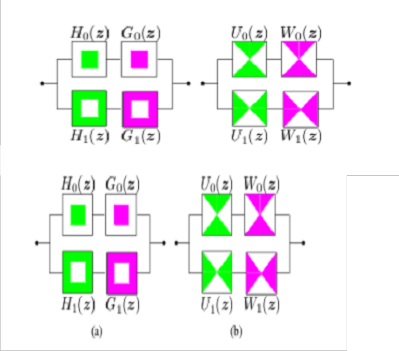
Fig 3.21: Ideal frequency response of the building block of (a) nonsub- sampled pyramid; (b) nonsubsampled DFB [11]
The ideal frequency response of the building block of nonsubsampled pyramid is given in the fig- ure. Nonsubsamled Filter Bank NSFB is built from lowpass filter Ho (z).
IJSER © 2013
http://www.ijser.org
H1(z)=1-Ho (z).
International Journal of Scientific & Engineering Research, Volume 4, Issue 4, April-2013 1169
ISSN 2229-5518
Corresponding synthesis filters Go (z) =G1 (z) =1. The perfect reconstruction condition is given as
Ho (z)Go (z) + H1 (z)G1 (z) = 1
Thus the system is perfect reconstruction. To achieve
multiscale decomposition nonsubsampled pyramids are con-
structed by iterated nonsubsampled filter banks. For next level upsample each filters by 2 in both dimensions. Figure 3.32 illustrates proposed nonsubsampled pyramid decomposition with 3 stages. resulting frequency division is as shown in figure 3.23 .
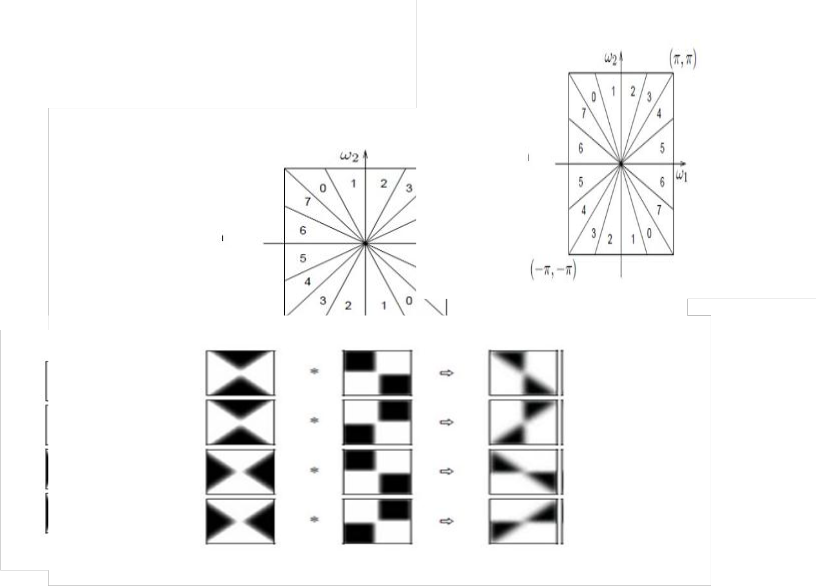
3.3.2 Nonsubsampled Diretional Filter Banks(NSDFB)
The directional filter bank of Bamberger and Smith is constructed by combining critically-sampled two- channel fan filter banks and resampling operations.
downsamplers and upsamplers. A shift-invariant directional expansion is obtained with a non-subsampled DFB (NSDFB)[14] which is constructed by eliminating the downsamplers and upsamplers in the DFB tree structure and upsampling the filters accordingly. The DFB is implemented via a l-level tree structured decomposition that leads to2l sub- bands with wedge shaped partition.
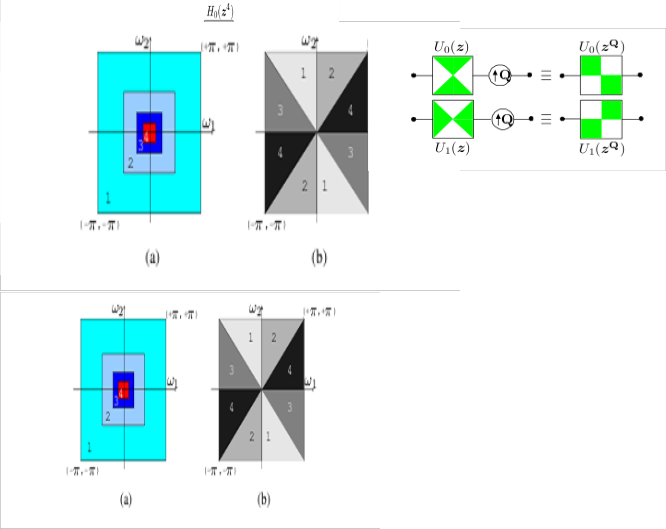
In the first stage frequency spectrum of input signal is divided into a horizontal and vertical channel using fan filter pair. Fan filters are obtained from dia- mond shaped filter pair by modulating the filters by in either the wo or w1 variable. In the second level of DFB upsampled fan filters when combined with filters in first level give four directional frequency decomposition shown in the figure3.34. Fan filters upsampled by quincunx matrix and gives the quadrant response as shown in the figure
Figure 3.34: Upsampling filters by quincunx matrix Q[11]
If we give a two-level four-channel filter banks, in the second level, the up- sampled fan filter Uj (z ^Q), j = 0,
1, and when combined with the filters in the first level
Ueq (z) = Ui (z)Uj (z), (i = 0, 1) give the four direc- tional frequency decomposition. (3.33)
In the third stage of DFB resampling matrices with fan filters are used.Fan filters upsampled by resampling ma- trices give parallelogram shaped response. Four types of resampling matrices are
Fig 3.33 Frequency divisions of: (a) a nonsubsampled pyramid given in
Fig. (b) a nonsubsampledDFB.[11]
The result is a tree-structured filter bank that splits the two dimensional frequency plane into directional wedges. In the design of DFB, the shift-invariant direc- tional expansion is not obtained because of existing
IJSER © 2013
http://www.ijser.org

4, April-2013 1170
of a periodic signal is still periodic. Therefore, we can periodically extend the input and only compute the out-
Figure 3.37: Frequency partitioning after 3 levels[11]
Figure 3.35,3.36: Frequency division after 2 levels[11]
Parallelogram filters are further upsampled . Parallelogram filters combined with quadrant filter output partition frequency spectrum of signal into 8 directions as shown in figure 3.37. The size of the upsampled filters becomes very large for the higher level de- composition of either nonsubsampled pyramids or nonsubsampled DFB. Specifically, the filter sizes of nonsubsampled pyramids grow by 4 every level, while those of nonsubsampled DFB grow by 2 every level. Since convolution complexity grows exponentially with the size of the filter, the complexity of this implementation is very high, even when we use the fast Fourier transform (FFT) to implement the convolution. We usually require that the size of the convolution output be the same as that of the input. So periodic extension is used. The idea of periodic extension is that the convolution output
3.4 Artificial Neural Network[15]
Artificial Neural Network are biologically inspired ;that is they are composed of elements that perform in a manner that is analogous to the most elementary function of the biological neuron. Neural Net- work is the term used to describe the group of neurons in the mammalian brain. A neuron is a unit of the brain pro- cessing block,thousands of these is interconnected in the human brain and functions simultaneously .ANN is essentially the way to simulate this biological neural network artificially. One of the main difference ,between human brain operation and a conventional computer system,is that the human brain can learn and process new information .
3.5 Probabilistic Neural Network[16][17]
The probabilistic neural network was proposed by Donald Specht[16] .His network architecture was presented in two papers , Probabilistic Neural Networks for classifica- tion, Mapping or Associative memory and Probabilistic Neural Networks,released in 1988 and 1990, respectively. This network provides a general solution to the classification prob- lems by following an approach developed in statistics ,called bayesian classifers. Bayes theory ,developed in 1950's, takes in account the relative likelihood of events and uses a priori information to improve prediction. The network paradigm also uses Parzen Estimators which were developed to construct the probability density function required by Bayes theory .The PNN uses a supervised training set to develop distribution function within a pattern layer. These functions in the recall mode ,are used to estimate the likelihood of an in- put feature vector being part of a learned category,or class
IJSER © 2013
http://www.ijser.org
International Journal of Scientific & Engineering Research, Volume 4, Issue 4, April-2013 1171
ISSN 2229-5518
.The learned patterns can be combined , or weighted ,with the a priori probability ,also be combined , or weighted ,with the priori probability ,also called the rela- tive frequency,of each category to determine the most likely class for a given input vector. If the relative frequency of the categories is unknown ,then all categories can be assumed to be equally likely and the determination of category is solely based on the closeness of the input feature vector to the distribution function of a class.
PNN consists of feed-forward four layers,that is,an input layer,a kernel layer, a summation layer, and a decision layer. All PNN networks have four lay- ers:
1.Input layer: There is one neuron in the input layer for each predictor variable. The input neurons standardizes the range of values by subtracting the median and dividing by a inter- quartile range. The input neurons then feed the values to each neuron of the hidden layer.
2.Kernel/ Hidden layer : This layer has one neuron for each
case in training data set. The neuron stores the values of the
predictor variables for the case along with the target value.
When presented with the x vector of input values from the
input layer,the hidden layer computes the Euclidean distance
of the test case from the neuron's center point and then applies
the RBF kernel function using the sigma value(s).The resulting
value is passed to the neuron in the pattern layer.
3.Pattern layer/Summation layer: In this layer ,there is one
pattern neuron for each category of the target variable. The
actual target category of each training case is stored with
each hidden neuron ; the weighted value coming out of the hidden neuron is fed only to the pattern neuron that corre- sponds to the hidden neuron category. The pattern neurons add the values for the class they represent.
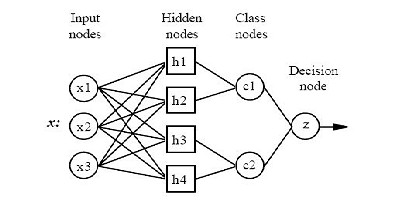
4.Decision layer: This layer compares the weighted votes for each target category,accumulated in the pattern layer and uses the largest vote to predict the target category.
Figure 3.51: PNN Architecture [17]
The general classification problem that determine the class membership of a multivari- ate random vector X into one of the N possible groups N= (n1,n2...nm).If we know that the Probability Density
Function (PDF),hn(x),for all groups,then according to the Bayes optimal decision rule we classify X into population i if the following inequality holds,
picihi(x)>pjcjhj(x)
where,
p= the prior probability of membership in a group n and c=the cost of misclassification into group n.
Although the implementation is very different
,probabilistic neural networks are conceptually similar to
K-Nearest Neighbourhood (K-NN )Models. The basic idea is
that a predicted target value of an item is likely to be about the
same as other items that have close values of the predictor
variables.
4. PROPOSED SYSTEM
The proposed system has three stages: preprocessing, feature extraction and selection, and classification process.
4.1Preprocessing stage
4.1.1. Mammogram image data source[19]: It is difficult to access real medical images for experimentation due to priva- cy issue. The data collection that was used in our experi- ments was taken from the Mammographic Image Analysis Society (MIAS) [30]. It consists of 322 images, which belong to three categories: normal, benign and malign, which are considered abnormal. In addition, the abnormal cases are further divided into six categories: circum- scribed masses, spiculated masses, microcalcifications, ill- defined masses, architectural distortion and asymmetry. All images are digitized at a resolution of 1024x 1024 pixels and eight-bit accuracy (gray level). They also include the loca- tions of any abnormalities that may be present. The existing data in the collection consists of the location of the abnor- mality (like the
centre of a circle surrounding the tumour), its radius, breast position (left or right), type of breast tissues (fatty, fatty- glandular and dense) and tumour type if exists (benign or malign).
4.1.2. ROI Selection: Using the locations of any abnormali- ties supplied by the MIAS for each mammogram, the ROI of size 32x32 pixels is extracted with microcalcification centred in the window, and divided into two sets: the training set
and the testing set. We used 100 images for normal cases, and 25 images for microcalcification cases (13 be- nign images and 12 malignant images).
4.2 Feature Extraction and selection
Features are extracted from the ROI based on the Non sub sampled countourlet decomposition process. These features are passed to the feature selection stage. There are four processing steps in the features extraction stage. Features, in our system, are extracted from the coefficients that were produced by the NSCT analysis decomposition. In this section we discuss these steps.
IJSER © 2013
http://www.ijser.org
International Journal of Scientific & Engineering Research, Volume 4, Issue 4, April-2013 1172
ISSN 2229-5518
4.2.1. NSCT decomposition: In this work, the NSCT de- composition applied on the region of interest using the Matlab toolbox . The output of NSCT analysis are the coarse image and the related fine directional images. Here we have chosen one level of laplacian pyramid with three levels of directional filter bank.
4.2.2. Coefficients extraction: The last two directional im- ages of the eight directional images are chosen to be the inputs of the the next stage.
4.2.3. Normalization: The normalization process is achieved by dividing each vector by its maximum value.
4.2.4. Energy computation: We compute the energy for each vector by squaring every element in the vector. The produced values are considered as features for the classification process .
4.3. Classification
The classification process is divided into the training phase and the testing phase . In the training phase, known data are given. Separately, the data on a candidate re- gion which has already been decided as a microcalcification or as normal
are given, and the classifier is trained. In the testing phase, unknown data are given and the classification is performed using the classifier after training .Here we can use the Proba- bilistic Neural Network for classification. We measure quanti- tatively, the detection accuracy,sensitivity and specificity on the data . Sensitivity is the conditional probability of de- tecting cancer while there is really cancer in the image. Specificity is the conditional probability of detecting nor- mal breast while the true state of the breast is normal.
.
5.. Requirement Analysis
5.1 Hardware Requirements
5.1.1 TMS320C6455 DSK[18]
The DSK features the TMS320C6455 DSP, a 1.2 GHz device delivering up to 8000 million instructions per second (MIPs) and is designed for products that require the highest performing DSPs.It is one of the DSK'S in which high parallel- ism
can be exploited.Also the cost is comparatively less, making it suitable for educational purposes
5.2 Software Requirements
5.2.1 MATLAB
MATLAB is a powerful, comprehensive, and easy to use environment for technical computations. It provides engineers, scientist, and other technical professionals with a single interactive system that integrates numeric computation, visualization, and programming. MATLAB includes a family of application specific solutions called toolboxes.
5.2.2 Dev-C++
Dev-C++ is a free integrated development envi- ronment (IDE) distributed under the GNU General Public License for programming in C and C++. MinGW, afree compiler, is bundled with it. The IDE is written in Delphi.The project is hosted by SourceForge. Dev-C++ was originally developed by programmer Colin Laplace. Dev-C++ runs exclusively on Microsoft Windows.Bloodshed Dev-C++ is a full-featured Integrated Development Environment (IDE) for the C and C++ programming languages.
5.2.3 Code Composer Studio(CCS)
CCS provides an IDE to incorporate the software tools.CCS includes tools for Code generation ,such as C com- piler, an assessment, and a linker. It has graphical capabili- ties and supports real time debugging. It provides an easy to use software tool to built and debug programs. The C com- piler compiles a c source program with extension .c to pro- duce an assembly source file with extension .asm .The assem- bler assembles a .asm source file to produce a machine language object file with the extension .obj. The linker combines object files and object libraries as input to produce an executable file with extension .out. This executable file represents a linked common object file format (COFF), popular in Unix-based systems and adopted by
several makers of DSP's.
6. Simulation Results
This chapter presents the simulation results in pre- processing , feature extracting and classifying process. In this the simulations have been done using MATLAB (version
7.1).The entire chapter has been classified into several subunits as:
6.1 Original image from the MIAS Database
The MIAS data base contains about 322 breast im- ages of different categories of which 25 images contain micro- calcification. The size of the images are 1024x1024 pixels and 8
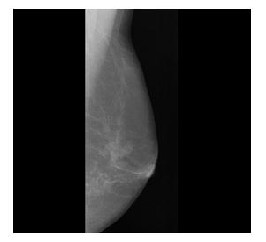
Figure 6.1: Normal Breast Mammogram mdb 60
IJSER © 2013
http://www.ijser.org
International Journal of Scientific & Engineering Research, Volume 4, Issue 4, ISSN 2229-5518
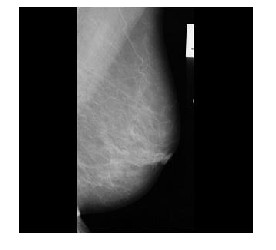
Figure 6.2: Abnormal Breast Mammogram mdb 219
6.2 Cropped image
In order to reduce the memory requirement of the device and considering the breast topography,we cropped the image to a size 32x32.
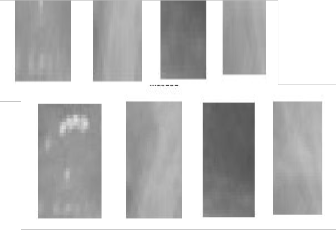
Figure 6.3: Cropped images( size 32x32 )
6.3 NonSubsampled Countourlet Transform
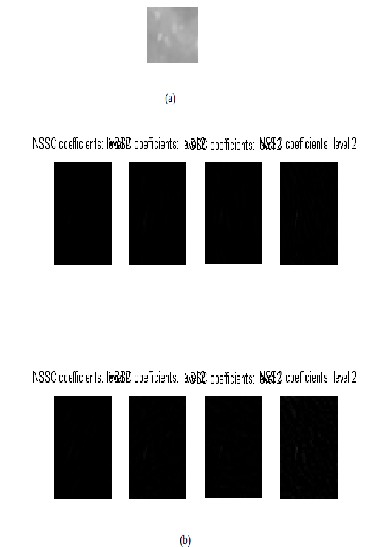
Figure 6.4: (a)Low Pass output (b) 8 Directional subbands after NSCT
The cropped images are then transformed by using the
IJSER © 2013
http://www.ijser.org
International Journal of Scientific & Engineering Research, Volume 4, Issue 4, April-2013 1174
ISSN 2229-5518
NSCT.Here for simplicity one LP with Three Directional filter bank are used. Here more number of LP and DFB's, may con- versely affect the classification.
6.4 Energy calculation
Cropped region from “mdb003”.
3.6718693e+000 4.0817994e+001 4.6742656e+001
3.7234805e+002 4.7296491e+001 3.9014108e+002
4.2650167e+002 3.7023222e+003
Cropped region from “mdb038”. Cropped region from “mdb223”. Cropped region from “mdb209”.
Cropped region from “mdb252”.
1.6174975e+003 1.8813971e+004
6.5 PNN classification
Here we can chosen the Probabilistic Neural Network for the purpose of classification because of its high versatility and accuracy as compared to back propagation. propagation.
Table 6.1 : Results after testing
Total 35 30 2 3

Sensitivity = 90 % Specificity = 80% Overall Accuracy = 85 %
7. Implementation and Coding Results.
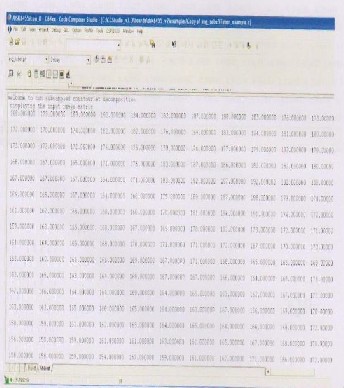
The contourlet part has been implemented in the ts
Fig 7.1 : Input image displayed
Type | No. Of ROIs | TP | FP | FN | % Detection |
Normal | 20 | 18 | 2 | - | 90 |
Abnormal with calcification | 15 | 12 | - | 3 | 80 |
IJSER © 2013
http://www.ijser.org
4, April-2013 1175
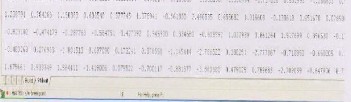
Fig 7.2 : 7th sub-band displayed
Fig 7.3 : 8th sub-band displayed
8. Conclusion and Future Scope.
In this work,an efficient algorithm for the detection of microcalcification in mammogram ,has been proposed
.Simulations in the MATLAB showed excellent results. The code for the NSSCT decomposition of the mammogram in Dev
-C has been verified.The difference between the values in both platform were negligible. Work is being Carried out for im- plementing the Contourlet part on TMS320C6455 DSK.
The proposed system shows excellent results.The idea can be extended to the entire mammogram ,with a hard- ware with sufficient memory capacity.This can be considered as a future Work.The method can also be exploited to find the other abnormalities in breast such as masses ,distortions etc.Efficient classifers such as SVM can also be incorparated with the existing method ,which can produce even better re- sults.This provides a wide area of scope and research.The neural implementation can also be extended in hardware.
REFERENCES
[1] Verma, K., & Zakos, J.,” A computer-aided diagnosis system for digital mammograms based on fuzzy-neural and feature ex-
traction technique”, IEEE Transactions on Information Technology in
Bio-metrics, pp 219-223.
[2] Wang, T., & Karayiannis, N ,” Detection of microcalcification in digital mammograms using wavelet” IEEE Transactions Medical Imaging, pp 112-116,1998 .
[3] H.P. Chan, K.Doi, S.Galhotra, C.J.Vyborny, H.Macmahon,and P.M.Jokich,”Image Feature Anaysis and Computer-Aided Diagnosis in Digital Radiography”,Medi.Phy., Vol 14,pp 538-548., 1987.
[4] Deepa Sankar, Tessamma Thomas,”Fractal Modeling of Mammo- grams based on mean and Variance for the detection of Microcalcific a- tion”International Conference on Computational intelligence and Multi- media Application ,pp 334,2007.
[5] R.N.Strickland and H.I.Hahn.“ Wavelet Transform for detecting mi- crocalcification in Mammograms”, IEEE Transaction on Medical Imaging , Vol .15, pp 218-229,1996.
[6] Cheng H, Lui Ym ,Felimans RI,” A noval approach to microcalcific a- tion detection using fuzzy logic Technique”, IEEE Transction Medical Image,Pg 774- 780,1996.
[7] M. N. Do and M. Vetterli, “The contourlet transform: An effi-
cient directional multiresolution image representation,” IEEE Trans.
Image Proc., IEEE Transactions on Image Processing, Dec.2004.
[8] P. J. Burt and E. H. Adelson, “The Laplacian pyramid as a compact image code,” IEEE Trans.Commun., vol. 31, no. 4, pp. 532–540, April 1983. [9] M. N. Do and M. Vetterli, “Framing pyramids,” IEEE Trans. Signal Process., vol. 51, no. 9, pp.2329–2342, Sep. 2003.
[10] R. H. Bamberger and M. J. T. Smith, “A filter bank for the directional decomposition of images: Theory and design,” IEEE Trans. Signal Proc., vol. 40, no. 4, pp. 882–893, April 1992
[11] Arthur L. da Cunha, Jianping Zhou, and Minh N. Do, The
Nonsubsampled Contourlet Transform:Theory, Design, and Applica- tions, IEEE Transactions On Image Processing, VOL.15, NO.
10,OCTOBER 2006
[12] Mini .M.G, Tessamma Thomas, “A Neural Network Method for Mammogram Analysis Based on Statistical Features”, Proceedings of TENCON , pp-1489-1492, Oct-2003.
[13] J.S.Leena Jasmine,A.Govardhan,”Classification of Microcalcific a-
tion in Mammograms using Nonsubsampled Contourlet Transform
and Neural Network”,European Journal of Scientific Research , ISSN
1450-216X Vol.46 No.4 (2010), pp.531-539
[14] Kunio doi “computer aided diagnosis and its impact on radiol o-
gy”computer-aided diagnosis in medical imaging ,pp 38-45, 1999
[15] Neural computing Theory and practices : Philip D Wasserman1989
[16] Specht,D.F., “Probabilistic Neural Network”,Neural Net- work,3(1):109-118
[17] Probabilistic and General Regression Neural Net- workswww.dtreg.com/pnn.html
[18] www.ti.com.cn/general/cn/docs/lit/getliterature
[19] Mias database, www.mias.org
[20] www.breastcancer.org
[21] www.radiologyinfo.org/en/info
[22] www.cancer.gov/cancertopics/facts/detection/mammograms
IJSER © 2013
http://www.ijser.org