International Journal of Scientific & Engineering Research, Volume 6, Issue 2, February-2015 148
ISSN 2229-5518
Absorption studies of Creatinine using
Kinetic Reaction method by optical
Interference wavelength filter
Sreedhar MALLETI
Research scholar,Dept of Instrument Technology, college of engineering, Andhra university
Visakhapatnam,Andhrapradesh,India
email: sonofsreedhar@gmail.com,09440976843
Saradadevi MALLETI
Assistant professor,Department of pharmaceuitical chemistry,sreenivasarao college of pharmacy,andhrauniversity,Visakhapatnam
email: sarada_pharma30@yahoo.co.in,9849948784
Dr.Varaprasad PLH
Professor, Dept of Instrument Technology ,college of engineering, Andhrauniversity
Visakhapatnam,Andhrapradesh,India
e-mail:plhpuvvada@yahoo.co.in,09959036321, Dr.Bhujangarao A
Professor and Head of thedept of Instrument Technology ,college of engineering, Andhrauniversity
Visakhapatnam,Andhrapradesh,India
e-mail:dr_abrao@gmail.com,09603741102
![]()
![]()
Creatinine reacts with Picric Acid in an alkaline medium to form an Orange coloured complex [1-
5]. The rate of formation of this complex is measured by reading the change in absorbance at
505 nm in a selected interval of time and is proportional to the concentration of Creatinine. The reaction time and the concentration of Picric Acid and Sodium Hydroxide have been optimized to avoid interference from keto acids.
Creatinine + Picric Acid Orange coloured complex
Breakdown product of ‘creatinine phosphate’ in muscle produces at constant rate by the body and filtered out of blood by kidneys poor filteration of urine results rise in creatininelevel Calculation of creatinine clearance is required in the urine and blood.
Reag ent No. | Reagent | Compositi on | Concentrati on |
1 | Picrate Reagent | Picric Acid Preservativ e | 40 mM/L qs |
2 | Sodium Hydroxide | Sodium Hydroxide | 200 mM/L |
3 | Creatinine Standard | Creatinine Stabiliser | 2 mg/dl qs |
Unopened Reagents 1,2 are stable at Room
Temperature (15 – 300c) and reagent 3 is stable at
2-8° C until the expiry date mentioned on the container label.
IJSER © 2015 http://www.ijser.org
International Journal of Scientific & Engineering Research, Volume 6, Issue 2, February-2015 149
ISSN 2229-5518
The “Working Reagent” is stable for 7 days at 2-80
c.
Sample volume: 70µl serum;1 1 precision µl
Reaction temperature: 37 ̊ C
Cuvettes size: 5X6X25; 5mm opticl length; Reaction volume: 180-500 µl
Photometric system: interference filters of with static –fibre optics
Lamp: tungsten-halogen lamp Environment requirements: 15 ̊ C-30 ̊ C Humidity: 35%-80%
Atm.pressure: 800hPa-1060 hPa
Wavelengths:340 nm,405nm,450nm,510nm,546nm,578nm,630nm,67
0nm,700nm Half band width:≤12nm
Measurement range:0.1-4.0 Abs
Lamp: 12 V 50 VA tungsten-halogen
It is purely based on kinetic reaction. The reaction velocity is not related to the substrate concentration and remains constant in the reaction process. As a result, for a given wavelength ,the absorbance of the reacting liquid changes evenly, and the change rate(∆A/min)is proportional to the activity or concentration of the subject, which is usually the enzyme.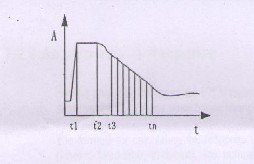
Fig.1.1.kinetic reaction method
In fact, it is impossible for the substrate concentration to be large enough, and the reaction will no longer a zeroth order reaction when the substrate is consumed to ascertain degree.therefore,the theory only stands within certain period. In addition the reaction can become steady only after a certain period. In addition, the reaction can become steady only after certain period because the reaction is complicated at the beginning and there are miscellaneous reactions due to the complex serum compositions. All reagent.
As shown in the above figure1.1,t1 is the time when the reagent is added.t2 is the time when the sample is added. From t3 the reaction becomes steady.tn is the time to stop testing the reaction.t3- t2 is the time delay, and tn-t3 is the monitoring time.
IJSER © 2015 http://www.ijser.org
International Journal of Scientific & Engineering Research, Volume 6, Issue 2, February-2015 150
ISSN 2229-5518
When a parallel monochromatic light beam whose intensity is Io goes through a flow cell(whose length is L) containing a solution (whose concentration is C),some photons are absorbed, and the intensity is attenuated from Io to I t,so the absorbance A of this solution is:
A=-Log It/I0
Where, It/I0= transmittivity
For the analyzer, the response(R)is defined as the absorbance change before and after the reaction,or the absorbance change rate during the reaction process.
As shown in the above figure1.1,
t1- is the time when the regent(volume) is added
t2- is the time when the sample(volume:S)is added. t3 -is the time from which the reaction becomes
steady
tn- is the time when the test result on the reaction is stopped (t3-t2) -is the time delay
(tn-t3)- is the reaction n time
The response is equal to the slope of the linear section between t3 and tn.
S.N O | Time(S ec) X12 | P.Wa ve length (nm) | P.Absorba nce | S.wa ve lengt h (nm) | S.Absorba nce |
1 | 12.0150 | 26926 | -561 | 1447 0 | -716 |
2 | 24.0310 | 26929 | -562 | 1447 2 | -717 |
3 | 36.0460 | 26933 | -564 | 1446 9 | -715 |
4 | 48.0460 | 26939 | -565 | 1447 1 | -717 |
5 | 60.0780 | 26935 | -564 | 1447 2 | -717 |
6 | 73.3120 | 26936 | -565 | 1447 | -720 |
IJSER © 2015 http://www.ijser.org
International Journal of Scientific & Engineering Research, Volume 6, Issue 2, February-2015 151
ISSN 2229-5518
(Primary wave length filter)
s.no | Time(sec) | Primarywave length(nm) | Primary absorption |
1 | T1=278.515 | 26383 | -384 |
2 | T2=410.781 | 25785 | -185 |
3 | T3=543.125 | 25523 | -97 |
4 | Tn=591.328 | 25441 | -69 |
5 | Tn- t3=48.203 | An-A3=28 |
(secondary wave length filter) (TABLE:05)
S.no | Time(sec) | Secondary wave length(nm) | Secondary absorption |
1 | T1=278.515 | 14307 | -618 |
2 | T2=350.718 | 14281 | -602 |
3 | T3=422.76 | 14320 | -626 |
4 | Tn=398.687 | 14311 | -620 |
5 | Tn- t3=24.073 | An-A3=6 |
Calculations
Primary wave length filter: Tn-T3=48.203 sec Absorbance:An-A3=28
Response or the Slope of the linearization portion is=[(391-(-381)]/(362.609-278.515)
=-10/84.094=0.11 Abs per sec
secondary wave length filter:

30000
Tn-T3=24.073sec
Absorbance :An-A3=6
Slope of the linearization portion is=[(-621-(-
629)]/(567.171-507.156)=8/60.015=0.133 Abs per
A b 20000 b a 10000 s n
o c 0
r e -10000
time
P.Wave length
P.Absorba nce
sec
(TABLE:06)(comparision of two filters)
IJSER © 2015 http://www.ijser.org
International Journal of Scientific & Engineering Research, Volume 6, Issue 2, February-2015 152
ISSN 2229-5518
Hence it is concluded that by using the kinetic eaction method the response of the secondary wavelength filter to the creatinine of the human serum is much better than primary wave length filter.
i.Murray R.L: Non Protein nitrogen compounds, in Clinical chemistry: Theory, Analysis and Co Relation, Kaplan L.A. and Pesce A.J; Eds.
C.V. Mosby, Toronto, 1984. P1230-1268.
ii.Bowers L.D; Clin. Chem; 26,p551-556(1980)Young D; In
Effect of Preanalytical variables on Clinical Laboratory Tests,
2nd ed; AACC Press, Washington, 1997,p4-494
iii.Newman D.J; price C.P; Renal Function and Nitrogen Metabolites, InTietz Textbook of Clinical Chemistry, 3rd ed., Burtis C.A. and Ashwood E.R., Eds. W. B. Saunders, Philadelphia,1999, p 1204-1264.
iv. Kaplan A., Lavernal L. S., The kidney and tests of Renal Function, In Clinical Chemistry: Interpretation and Techniques, 2nd ed., Lea and Febiger, Philadelphia, 1983, p 109-
142.
v. Mathew TH. Australasian Creatinine Consensus Working Group. Chronic kidney disease and automatic reporting of estimated glomerular filtration rate: a position statement. Med J Aust. 2005;183:138–41. [PubMed].
vi.. Levey AS, Coresh J, Greene T, et al. Expressing the MDRD study equation for estimating GFR with IDMS traceable (gold standard) serum creatinine values (abstract) J Am Soc Nephrol. 2005;16:69A.
vii.. NKDEP Website (accessed 11th October
2006).http://www.nkdep.nih.go/ viii.. Jaffe M. Uber den niederschlag, welchen pikrinsaure in normalen hrn erzeugt und uber eine neue reaction des kreatinins. Z Physiol Chem.
1886;10:391–400.
ix.. Haeckel R. Assay of creatinine in serum, with use of
Fuller’s Earth to remove interferents. Clin Chem. 1981;27:179–
83.[PubMed]
x.. Cook JG. Factors influencing the assay of creatinine. Ann
Clin Biochem. 1975;12:219–32. [PubMed]
xi. Chasson AL, Grady HJ, Stanley MA. Determination of creatinine by means of automatic analysis. Am J Clin Pathol.
1961;35:83–8.
xii. sample data and reaction data (sample type: human serum) andhra medical college,VisakhapatnamA,P state,india.
IJSER © 2015 http://www.ijser.org
International Journal of Scientific & Engineering Research, Volume 6, Issue 2, February-2015 153
ISSN 2229-5518
Author’s Profiles
![]()
Sreedhar.Malleti is presently a research scholar of Department of Instrument technology,Andhrauniversity,visakhapatnam. He worked as executive(instrumentation) in food industry for 2years.he was also the former associate professor and head of the department in Sir C.R.Reddycolllegeofengineering,eluru,westGodavari(dt),andhrapra desh,India.
![]()
Ms.Saradadevi malleti is presently working as Assistant professor in sreenivasarao college of pharmaceutical sciences affiliated Andhra university,Visakhapatnam,Andhra Pradesh,india.She was submitted her thesis report on chalcones synthesisin the year 2013 and awaiting for the award of the same. she did her post graduation in pharemaceutical sciences in Andhra university, Visakhapatnam,
![]() Dr.A.Bhujangarao is currently a Professor and Head of the Department of Instrument technology,Andhrauniversity,Visakhapatnam,Andhrapradesh,India
Dr.A.Bhujangarao is currently a Professor and Head of the Department of Instrument technology,Andhrauniversity,Visakhapatnam,Andhrapradesh,India
.rauniversity,Visakhapatnam,Andhrapradesh,India.He Obtained his PhD in Instrument technology from Andhra university. He had published several national and international journals. He has guided some of research scholars. He was also worked as Chairman for Board of studies for Instrumentationengineering,Andhrauniversity,visakhapatnam.
![]()
Dr.P.L.H.Varaprasad is currently retired Professor and Head of the Department of Instrument technology of Andhra university, Visakhapatnam, Andhrapradesh, India. He Obtained PhD in Instrument technology of Andhra University. He had published several national and international journals. He has guided some of researchscholars.he is very much interested in the area of thin film technology. He was also worked as Chairman for Board of studies
for Instrumentation engineering of Andhra University.
IJSER © 2015 http://www.ijser.org