International Journal of Scientific & Engineering Research, Volume 5, Issue 7, July-2014 733
ISSN 2229-5518
AUTOMATION OF DEFORMATION ANALYSIS USING FPGA AND EMBEDDED SYSTEMS
Kondabolu Nishanth, P.S.S.Sashank.
Abstract-This paper details a machine vision algorithm for strain analysis by edge detection method. The algorithm was developed on universal testing machine .The current work improves the deformation analysis by Robert’s edge detection. The algorithm extends for computation of deformation and Comparative analysis with digital image correlation. It demonstrates automation by stipulated hardware and strain analysis with matlab image processing toolbox. The software implementation of deformation analysis through edge detection is slower due to the constrained processor speed so Dedicated processors can increase the process speed. This paper tries to increase computational capability of metal deformation by design of dedicated hardware with the help of FPGA
Index Terms— Edge detection, Necking, Machine Vision, Digital Image Corellation, FPGA
—————————— ——————————
Machine vision is a branch of technology that provides auto- matic image based inspection for applications in various
fields [1][11]. The basic difference between computer vision and machine vision is machine vision is completely related to industry where as computer vision applicable to tracking, mo- tion sensing, pattern recognition and autonomous control [2][3]. From 1980’s with the increase in the data rates of com- puters increased the scope of research in the field of machine vision [4].This paper emphasizes the application of machine vision using embedded system and FPGA by stoping the load cell of UTM before the point of necking (Point of first defor- mation of specimen) when the metal specimen is subjected to load test. In later section the process of edge detection is im- planted on the FPGA for achievable high speed.
Strain analysis is having a very high importance in mechanical
sciences [5].strain analysis quantify the deformation of an ob- ject. Selection of a material for a particular application de- pends on the capacity of strain that it can withstand. The Me- chanical instrument widely used for this prose is universal testing machine [6].
Edge detection is an subjective part of image analysis. Edge
detection involves finding difference between greylevels. The difference between two regions can be obtained by finding the derivative of greylevels over the image [12]. Edge detection is mainly used in the fields of image segmentation, image regis- tration [13]. When these edges are identified in precision, all the fundamental measurements like area, perimeter and radi- us of particular regions present in an image can be measured which could be a powerful tool in strain analysis.
A universal testing machine (UTM) is fast, accurate and easy to operate [7]. The programmable load is applied to the system through a serial communication port, output of the port is giv- en as an input to a data acquisition system to which a load cell is connected. When the load is applied the corresponding ana-
log signal is converted to digital by the data acquisition system and the corresponding digital values are shown in the digital display [8].
Vast ranges of programing tools are available such as visual
c++, visual java etc. with very efficient machine vision analysis. These are most accurate and powerful tools but these are very complex codes to implement [14]. Matlab is easier and com- fortable when compared to other computing languages. Here the data is taken in the form of matrices, many inbuilt func- tions are present for easy computations [12].These special functional blocks are called toolboxes, each toolbox have their own significance and is used for a specific application. Main toolboxes that are used in for this application are image pro- cessing toolbox, image acquisition toolbox and speech pro- cessing toolbox.
This paper extends the scope of research through edge detec- tion of the specimen under test on Universal Testing Machine
.When the specimen tested reaches its necking point the corre- lation of the video frames that are acquired from video captur- ing device is done by edge detection. If the deformation of specimen is observed the hardware is triggered by a speech signal to stop the load cell of UTM without leading the speci- men for further deformation. The threshold for edge detection algorithm should be in minimal level in order to acquire ana- lyzed specimen without any damage. Each video frame has its own pixels after edge detection and these deformed pixel val- ues of each frame are compared with each other as the load applied on the specimen is increased. The necking point can be found by this process of correlation.
This paper is organized into two sections: In section I we dis-
cuss about key results obtained during edge detection of the metal specimen and automation of the UTM to terminate the process of applying load using a hardware trigger when the
IJSER © 2014 http://www.ijser.org
International Journal of Scientific & Engineering Research, Volume 5, Issue 7, July-2014 734
ISSN 2229-5518
deformation of the specimen is above the threshold. In section
II implementation of edge detection on FPGA is done in order
to achieve high speed
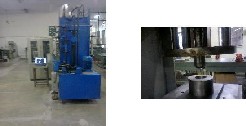
A Universal testing is also known as universal tester, material testing machine or a material test frame. It is named under the fact that I can perform any standard tensile test on ma- chines components[15] A Universal Testing Machine essen- tially consists of a force transducer called as load cell and a movable crosshead to move the load cell up and down on to the load. The specimen is placed in between the grips and the load cell is imposed on to the load calculating the strain beard by the engineering material [15].
Fig2.1: Experimental setup of UniversalTesting Machine
Image Acquisition for the deformation analysis is performed by using a standard digital web camera of
Image size 4000 x2248.
Fig 2.2: Initial specimen on w hich test is conducted
Fig 2.3: Specimen after deformation due to applied load
3. EMBEDDED ARCHITETURE FOR HARD- WARE DESIGNING
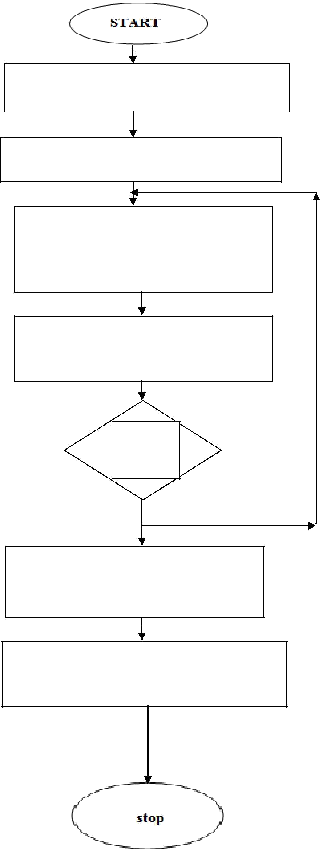
The Architecture provided here will be able to disconnect the load application process on the specimen when the edges are detected at the point of necking as shown in Fig2.4. Initially video is acquired from the device and individual frame con- version is done. Edge detection algorithm is applied on these individual frames to get the percentage of deformation during load application on specimen. Speech signal is initiated when the percentage of deformation is greater than a particular val- ue. This speech signal is carried out of the MATLAB environ- ment using MIDI jack and this jack is connected to a circuit which can disconnect the load on specimen. As we move fur- ther these interface circuits used to disconnect load are clearly explained.
Trigger must be given to microcontroller when the necking point is found using the correlation of each video frame. At the point of necking the trigger carried to the load cell with help of a microcontroller circuit will terminate the applica- tion of load on specimen making the system to automatically stop the process of load application. The speech processing tool box is initialized by algorithm as shown in Fig 3.1. Inter- face from the computer to the external environment should occur concurrently with the video captured. So design of hardware should be minimum this is achieved by producing a triggering audio signal which can be converted to electrical signal by using an audio MIDI jack.
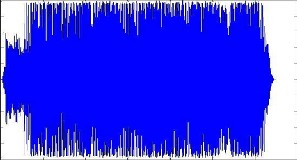
Here Software to hardware interface is performed by using speech processing toolbox in matlab. Speech processing technology which is an embedded in-voice technology used for many applications. Here a standard speech signal with sampling frequency of 8kilo hertz and amplitude of 1v is taken
Different edge detection algorithms are applied on the speci- men shown in fig2.2 using UTM and results are produced. Roberts edge detection algorithm got the best result when its efficiency is calculated[15]. Using Roberts algorithm the cap- tured image of specimen is detected for its edges. As the load applied on specimen increases the point of necking occurs on the specimen due to load. Detected edges of specimen on UTM are shown in fig 2.4 and fig 2.5.
0.6
0.8
0.6
0.4
0.2
0
-0.2
- 0.4
0 50 100 150 200 250 300 350
Fig 3.2 : Amplitude vs time graph of speech signal gener- ated as a trigger using MATLAB
IJSER © 2014 http://www.ijser.org
International Journal of Scientific & Engineering Research, Volume 5, Issue 7, July-2014 735
ISSN 2229-5518
.
Read the video from the image acquisition device through the webcam
Convert the continuous video into frames
Apply edge detection algorithm and define the database for percentage of deformation
Calculate the percentage of deformation of pix ls for each frame
IF COUNT
=THRES
Start the speech signal by using standard speech processing toolbox in matlab
Convert the speech signal to electrical signal by using MIDI jack to
trigger the hardware
At the point of necking i.e when the pixel count is matched with the deformation margin of database the above speech signal is generated by the software this is transferred to the external environmental through a MIDI jack the corresponding output signal is an electrical signal. Here the MIDI jack is acting as a transducer
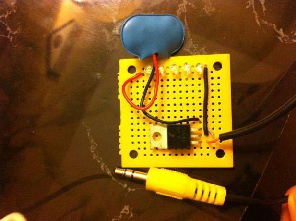
Fig 3.3: Hardware interface through TIP-31 power transis- tor
The circuit itself is very simple. A battery runs through a transistor to LEDs with an audio signal inputted. The tip31 transistor takes the power from the battery and holds it. Then the transistor which also has the
3.5mm audio jack connected waits for the signal to allow the charge to pass through a relay connected to supply of 5v with a microcontroller enhances the optimization
The optimized circuit consists of a microcontroller, a relay and a mo- tor driver the proteus simulation of the optimized circuit is shown in Fig3.4
This circuit will work in two different cases
1. Transistor is off
2. Transistor is on
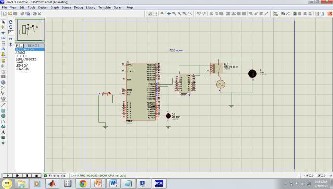
Fig 3.4 : Circuit when the transistor is “off” state
IJSER © 2014 http://www.ijser.org
International Journal of Scientific & Engineering Research, Volume 5, Issue 7, July-2014 736
ISSN 2229-5518
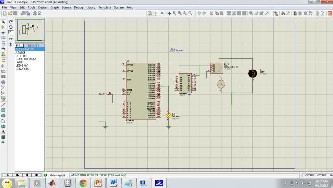
Fig 3.5 : Circuit when the transistor is in “on” state
This Circuit interfaced with MIDI jack can stop the load ap-
plied on specimen when MIDI jack picks up a speech signal. This speech signal is generated as an indication for the detec- tion of edges on the specimen at its point of necking when the load continuously applied as shown in Fig:2.4.
In section II the image of the specimen is extracted to the pc
and the picture information is transferred to the FPGA using parallel port communication and different signals for data reception and transfer are provided. Enhanced parallel port [EPP] is standard signaling method for the communication in between computer and other peripherals, It has bi-directional data transfer. The hardware implementation on FPGA requires raw pixel information. So the conversion image from any oth- er format to raw image. The extracted image is obtained in 2- dimentional array and individual values are assigned to each pixel ranging from 0 to 255.In case of a color image Red, Green, Blue components of the image are processed one after
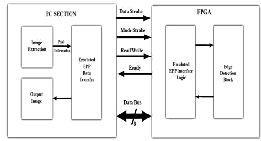
the other in FPGA. Interface circuitry is required for proper communication in between computer and the FPGA as the FPGA works with CMOS logic and computer works with TTL logic .74LS641 IC is used as the transreceiver which converts the CMOS and TTL logic levels to the respective devices. This device is used in parallel communication allowing bi-direction asynchronous communication between the two devices. The target device used here is the Spartan3 xa3s500e-4cpg132 and Speed -4.
Fig 4.1: Embedded Hardware Architecture
4.2 ARCHITECTURE FOR EDGE DETECTION
The block provides the required inputs and outputs of the edge detection system being implemented on FPGA. Inter- nally the system consists of RAM blocks in which the pixel values are stored and the computation is done. The bus sig- nal carry the pixel data and strobe signals are required to control the data Flow.
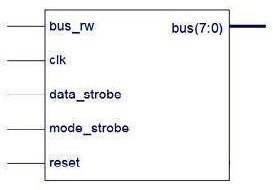
Fig 4.2 : Signal block for Edge detection
The input 8bt pixels are given to the edge detecting module and signals are P0, P1, P2, P3, P4, P6, P7 and P8. Signed sub- tractors, shift registers and modulus operators are used for the implementation of sobel edge detection. The module consists of signed subtractors, shift registers and modulus operators. The output of the final adder block will be 11 bits. 10 bits are
IJSER © 2014 http://www.ijser.org
International Journal of Scientific & Engineering Research, Volume 5, Issue 7, July-2014 737
ISSN 2229-5518
utilized for the data as the maximum value of the adder out- put is 4*255 and the 11th bit is the sign bit. The output data is compared to limit the value to a maximum of 255 as the out- put image is also composed of 8-bit wide pixels. 32 Sobel modules are used in parallel.. The implementation of the par- allel sobel operators depend on the logic resources
available on target device.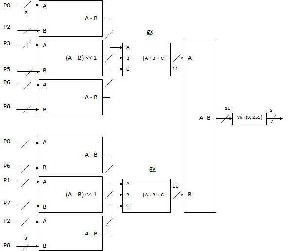
Fig 4.3: Hardware of edge detection using FPGA
The results of the above discussed algorithm are obtained by taking various trails of initial and final counts and finding the deformation variation, the difference of the pixel count is taken into the defama- tion margin of the database
Fig 5.1: Trail count of Pixels obtained for soft aluminium
In the above result the difference of the pixels is nearly about 1000000 pixels. Therefore large amount of deformation accuracy is obtained. In digital image correlation concept thecontinuous frames are compared with the previous frames and the deformation is calculated. By this process of edge detection the accurate value of pixels deformed at that instant can be obtained and at point of nicking, circuit is triggered by the speech signal which leads to the termination of load application on the specimen giving the detailed stress analysis.
In the second section the implementation of edge detection algorithm is done on FPGA Spartan 3 with the help of xilinx for the speed optimiza- tion of the process. The application of load is terminated on the speci- men by generating the signal from the FPGA itself as the deformation margin of the one video frame to other frame is exceeded.
[1] Kemao, Qian. "Two-dimensional windowed Fourier trans- form for fringe pattern analysis: principles, applications and im- plementations." Optics and Lasers in Engineering 45.2 (2007):
304-317.
[2] Cornwell, Pillip, Scott W. Doebling, and Charles R. Farrar. "Application of the strain energy damage detection method to plate- like structures." Journal of Sound and Vibration 224.2 (1999): 359-
374.
[3] Marinescu, Iulian, and Dragos A. Axinte. "A critical analysis of effectiveness of acoustic emission signals to detect tool and workpiece malfunctions in milling
operations." International Journal of Machine Tools and Manufac- ture 48.10 (2008): 1148-1160.
IJSER © 2014 http://www.ijser.org
International Journal of Scientific & Engineering Research, Volume 5, Issue 7, July-2014 738
ISSN 2229-5518
[4] Tian, Yuan, et al. "Automatic defect detection in X-ray images using image data fusion." Tsinghua Science & Technology 11.6 (2006): 720-724.
[5] Elkady, Tamer Y., William N. Houston, and Sandra L.
Houston. "Calibrated image processing for unsaturated soils testing." Proceeding of the 3rd International Conference on Unsaturated Soils, Editors: Juca, de Campos & Marinho, Rio de Janeiro. 2002.
[6] Arita, Takeshi, et al. "Speckle-tracking strain echocardiography for detecting cardiac dyssynchrony in a canine model of dyssynchrony and heart failure."American Journal of Physiology-Heart and Circulatory Physiology 293.1 (2007): H735-H742.
[7] Patsias, S., and W. J. Staszewskiy. "Damage detection using optical measurements and wavelets." Structural Health Monitoring
1.1 (2002): 5-22.
[8] Ya’akobovitz, Assaf, Slava Krylov, and Yael Hanein.
"Nanoscale displacement measurement of electrostatically actuated micro-devices using optical microscopy and digital image correla- tion." Sensors and Actuators A: Physical162.1 (2010): 1-7.
[9] Zhang, Shu Yan. High Energy White Beam X-Ray Diffrac- tion Studies of Strains in Engineering Materials and Compo- nents. Diss. University of Oxford, 2008.
[10] Chan, H. L., et al. "Laser Digitizer/Stereo Vision Methods for Simul- taneous Measurement/Analysis of Sheet Metal Forming Strain/Geometry." Proc. ASME International Mechanical Engineering Congress and Exposi- tion. 2005.
[11] Peli, Tamar, and David Malah. "A study of edge detection algo- rithms."Computer graphics and image processing 20.1 (1982): 1-21.
IJSER © 2014 http://www.ijser.org