International Journal of Scientific & Engineering Research, Volume 5, Issue 7, July-2014 696
ISSN 2229-5518
AN INVESTIGATION ON USE OF POWER SYSTEM STABILIZER ON DYNAMIC STABILITY OF POWER SYSTEM
Mr. Bhuwan Pratap Singh1, Student, M.Tech, Suresh Gyan Vihar University, Jaipur, Dr. M. P. Sharma2, AEN, RVPNL, Jaipur and Ms. Vishu Gupta3, Assistant Professor, Suresh Gyan Vihar University,Jaipur.
ABSTRACT
The low frequency electro mechanical oscillations (LFOs) are occurs in power system after change in generator reference voltage and generator reference power. Magnitude of these oscillations depends upon loading on generators and strength of power system. Magnitude of oscillations is comparatively high in weak transmission system and increases with loading on generator. In the present work, the effectiveness of AVR, without and with Power System Stabilizer (PSS) has been compared on low frequency oscillations. Simulation studies indicate that AVR having supplementary control signal from PSS, dynamic stability of power system increase. With PSS, power oscillations damp out faster after disturbance. Settling time of power system parameters is also reduce.
Key words: Power system stabilizers (PSS), Automatic voltage regulator (AVR).
1.0 INTRODUCTION
inside the plant are interconnected through an ICT of 1×315
MVA, 400/220 kV. Then the power is evacuated to Jodhpur
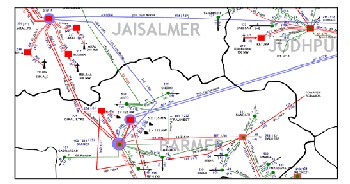
400/220 kV, Barmer 400/220/132 kV, and Dhaurimanna 220/132 kV grid substations through 220 kV and 400 kV transmission lines. Fig-1 gives the interconnection diagram in the vicinity of the RajWest power plant.
Fig-1: Interconnection diagram in the vicinity of the RajWest power plant
Transmission system voltage can be controlled by variation of generator excitation voltage. To increase the transmission system voltage, generator reference voltage is increased and vice versa. Power generation schedule of a generator is also required to vary as per system requirement. After the change in the generator reference voltage & power, speed of the generator oscillates due to electro-mechanical characteristic of generator. Due to oscillations in the speed, frequency of power generated by generator is also oscillate with respect to rest of the system. Power flows on transmission lines are swing. Power System Stabilizers (PSS) are the most efficient devices to damp these power system oscillations. In this paper, simulation studies have been carried out to show the effect of PSS on dynamic stability of system under step change in generator reference voltage and power.
2.0 POWER SYSTEM DATA
8×135 MW Lignite based pit head Rajwest power plant is situated in Barmer District of Rajasthan. All units are generating power at 13.8 kV voltage level. The two units are stepped up to
220 kV voltage level through 2x160 MVA, 13.8/220 kV generating transformers and the remaining six units are stepped up to 400 kV voltage level through 6x160 MVA, 13.8/400 kV generating transformers. Further 400 kV and 220 kV busses
Network reduction
In order to study the local modes of oscillations where the Rajwest power plant generators oscillates with the rest of the Rajasthan system, it is sufficient to reduce the network at the boundary busses i.e. Barmer 220 kV and 400kV, Dhaurimanna
220 kV and Jodhpur 400 kV with the dynamic equivalents. In the process of network reduction, some fictitious transformers are also added at the boundary busses based on the fault levels at the boundary buses.
Three phase fault levels at boundary buses
To arrive at the equivalent impedance at the boundary buses, three phases to ground fault is created at the boundary busses with the full system and the contribution from the other braches which are of no interest (not represented in reduced network) and to be represented in the equivalents are calculated and represented in the equivalent system.
Table-1 shows the three phases to ground fault contribution from
all branches connected to the specified buses.
IJSER © 2014 http://www.ijser.org
International Journal of Scientific & Engineering Research, Volume 5, Issue 7, July-2014 697
ISSN 2229-5518
Table-1: 3-Φ fault current at the boundary buses
S. No. | Fault at bus | 3-phase fault with reduced system in kA | 3-phase fault with full system in kA |
1 | Barmer 220 kV | 18.893 | 17.854 |
2 | Dhaurimanna 220 kV | 8.722 | 8.462 |
3 | Jodhpur 400 kV | 14.216 | 13.433 |
4 | Barmer 400 kV | 12.163 | 11.096 |
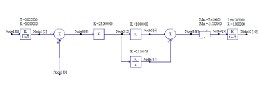
Single line diagram of power system network with load flow study results is placed in figure-2. Bus and branch data in IEEE format are placed at Appendix-1.
Figure-2: Single line diagram of power system for simulation
Generator Parameters
There are total 8 units of 135 MW rating at the Rajwest power plant. Generator parameters are same for all generators. Generator parameters are given in Table-2.
Table-2: Generator Parameters
Exciter System Details
The main function of AVR is to automatically adjust the field current of the synchronous generator to maintain the terminal voltage within continuous capability of the generator. All the generating units have the identical excitation systems i.e. AC excitation system (Field controlled alternator rectifier excitation system). The rectifier in this excitation system is stationary and is fed from the generator terminal. The voltage regulator controls the firing angles of the thyristors and converts AC in to appropriate DC. This DC supply is fed to field winding of the alternator through slip rings. The block diagram of the excitation system in the Fig-3.
Figure-3: Block diagram of Excitation System
The Excitation system parameters are same for all units i.e. the generators which are stepped up to 220 kV voltage level as well as the generators stepped up to 400 kV voltage level. Excitation parameters are given in table-3.
IJSER © 2014 http://www.ijser.org
International Journal of Scientific & Engineering Research, Volume 5, Issue 7, July-2014 698
ISSN 2229-5518
Table 3: Excitation system Parameters
Constant | Name | Parameter Value |
KA | Exciter Gain | 25 |
TR | Amplifier time constant in s | 0.02 |
TA | Integral Time Constant | 8.335 |
TS | Gate Control Unit and Converter Time Constant | 0.005 |
Ukmax | Maximum voltage in pu | 7.42 |
Ukmin | Minimum voltage in pu | -5.7 |
Power system Stabilizer
High performance excitation systems are essential for maintaining steady state and transient stability of modern synchronous generators, apart from providing fast control of the terminal voltage. But the fast acting exciters with high AVR gain can contribute to oscillatory instability in the power systems. This type of instability is characterized by low frequency (0.1 to 3 Hz) power oscillations which can persist (or even grow in magnitude) for no apparent reasons. This type of instability can endanger system security and limit power transfer. The major factors that contribute to the instability are
• Loading of the generator or Tie line
• Power transfer capability of transmission lines
• Power factor of the generators (Leading power factor operation is more problematic than the lagging power factor)
• AVR gain
A cost effective and satisfactory solution to the problem of oscillatory instability is to provide damping for generator rotor oscillations. This is conveniently done by providing Power System Stabilizers (PSS) which are supplementary controllers in the excitation systems. This supplementary signal is derived from rotor velocity, frequency, electrical power or combination of these variables. In this work, PSS use the electrical power signal to capture high-frequency dynamics
PSS Block Diagram
The block diagram of PSS used in the Rajwest power plant is shown in Fig-4. All the units in power plant have the same type of PSS.
Fig 4: PSS Block Diagram
The input to the PSS is electrical power (active) which is derived from the terminal of the generator. Each synchronous generator has the same input arrangement and the output of the PSS will act as a supplementary signal to AVR as shown in Fig-5. The PSS block diagram consists of Wash out circuit, dynamic lead lag compensators, and a limiter to limit the absolute value of PSS
output.
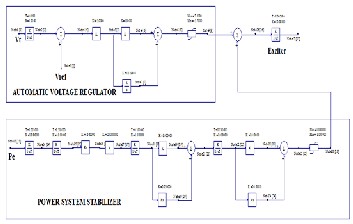
Fig-5: AVR with PSS Block Diagram
Table 4: PSS parameter settings range with actual settings
Parameter | Description | Unit | Range | Actual Settings |
T1 | Filter Time constant | s | 0.003~0.02 | 0.01 |
TW1 | Washout Time Constant | s | 0.01~15 | 1.5 |
Ks1 | PSS Gain Factor | pu | 0.1~100 | -25 |
TL1 | Time constant of conditioning network | s | 0.01~10 | 0.05 |
TL2 | Time constant of conditioning network | s | 0.01~10 | 0.1 |
TL3 | Time constant of conditioning network | s | 0.01~10 | 0.05 |
TL4 | Time constant of conditioning network | s | 0.01~10 | 0.1 |
Usmax | Upper limit of stabilizing Value | pu | 100% | +1.0 |
Usmin | Lower limit of stabilizing Value | pu | 100% | -1.0 |
3.0 SIMULATION RESULTS
Case 1: Step increase in the Generator G1 reference voltage by 5 percentages
IJSER © 2014 http://www.ijser.org
International Journal of Scientific & Engineering Research, Volume 5, Issue 7, July-2014 699
ISSN 2229-5518
Plots for foresaid disturbance are placed from fig-6 to fig-14. 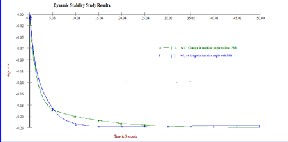
Fig-10: Variation in Machine angle in radians at Generator 1
(Time response up to 50 second)
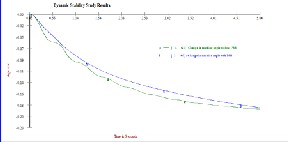
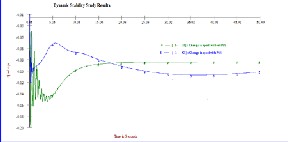
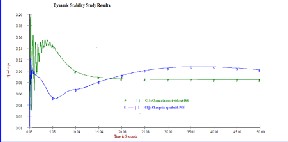
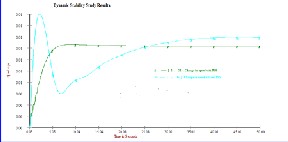
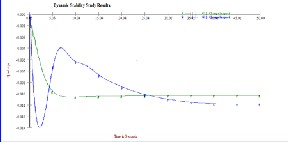
Fig-6: Variation in Machine speed in radians/sec at Generator 1 (Time response up to 50 second)
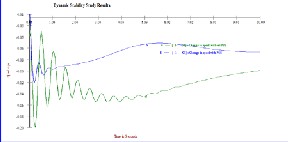
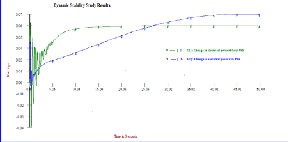
Fig-7: Variation in Machine speed in radians/sec at Generator 1 (Time response up to 10 second)
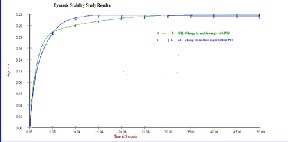
Fig-8: Variation in Machine Electrical power output in pu on
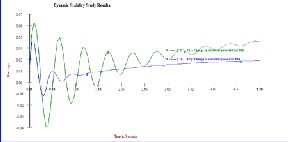
100MVA base at Generator 1(Time response up to 50 second)
Fig-9: Variation in Machine Electrical power output in pu on
100MVA base at Generator 1(Time response up to 5 second)
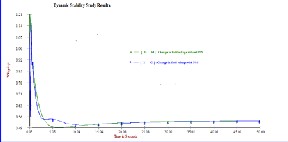
Fig-11: Variation in Machine angle in radians at Generator 1 (Time response up to 5 second)
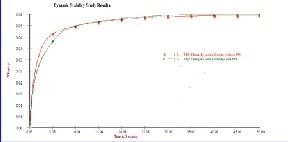
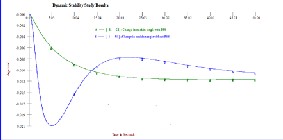
Fig-12: Variation in Machine Field voltage in pu at Generator 1
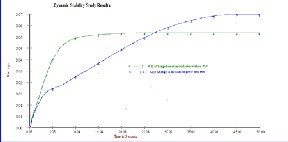
Fig-13: Variation in terminal voltage in pu at Generator 1
Fig-14: Variation in mechanical power input to Generator 1
IJSER © 2014 http://www.ijser.org
International Journal of Scientific & Engineering Research, Volume 5, Issue 7, July-2014 700
ISSN 2229-5518
Case 2: Step decrease in the Generator G1 reference voltage by 5 percentages
Plots for foresaid disturbance are placed from fig-15 to fig-23.
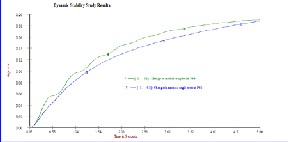
Fig-19: Variation in Machine angle in radians at Generator 1 (Time response up to 50 second)
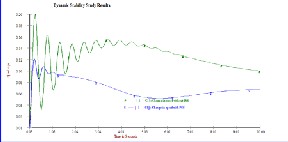
Fig-15: Variation in Machine speed in radians/sec at Generator 1 (Time response up to 50 second)
Fig-20: Variation in Machine angle in radians at Generator 1 (Time response up to 5 second)
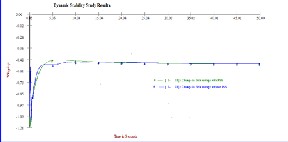
Fig-16: Variation in Machine speed in radians/sec at Generator 1 (Time response up to 10 second)
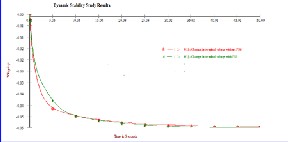
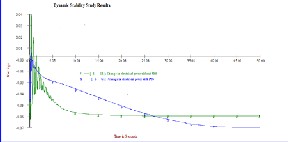 Fig-21: Variation in Machine Field voltage in pu at Generator 1
Fig-17: Variation in Machine Electrical power output in pu on
100MVA base at Generator 1(Time response up to 50 second)
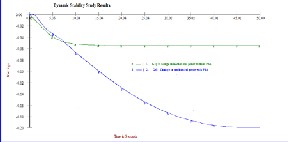
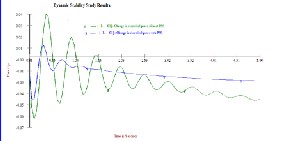 Fig-22: Variation in terminal voltage in pu at Generator 1
Fig-18: Variation in Machine Electrical power output in pu on
100MVA base at Generator 1(Time response up to 5 second)
Fig-23: Variation in mechanical power input to Generator 1
IJSER © 2014 http://www.ijser.org
International Journal of Scientific & Engineering Research, Volume 5, Issue 7, July-2014 701
ISSN 2229-5518
Case 3: Step increase in the Generator G1 reference power by 5 percentages
Plots for foresaid disturbance are placed from fig-24 to fig-32.
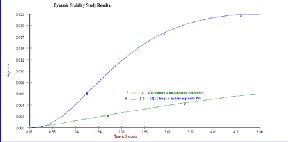
Fig-28: Variation in Machine angle in radians at Generator 1 (Time response up to 50 second)
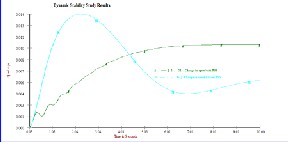
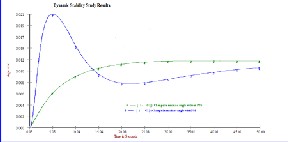
Fig-24: Variation in Machine speed in radians/sec at Generator 1 (Time response up to 50 second)
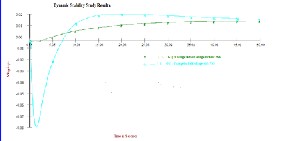
Fig-29: Variation in Machine angle in radians at Generator 1 (Time response up to 5 second)
Fig-25: Variation in Machine speed in radians/sec at Generator 1 (Time response up to 10 second)

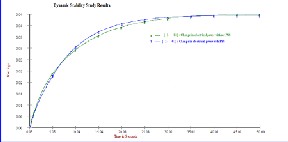 Fig-30: Variation in Machine Field voltage in pu at Generator 1
Fig-26: Variation in Machine Electrical power output in pu on
100MVA base at Generator 1(Time response up to 50 second)
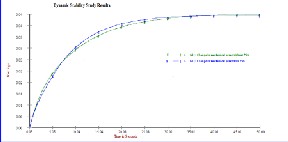
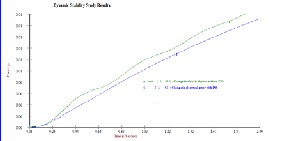 Fig-31: Variation in terminal voltage in pu at Generator 1
Fig-27: Variation in Machine Electrical power output in pu on
100MVA base at Generator 1(Time response up to 2 second)
Fig-32: Variation in mechanical power input to Generator 1
IJSER © 2014 http://www.ijser.org
International Journal of Scientific & Engineering Research, Volume 5, Issue 7, July-2014 702
ISSN 2229-5518
Case 4: Step decrease in the Generator G1 reference power by 5 percentages
Plots for foresaid disturbance are placed from fig-33 to fig-41.
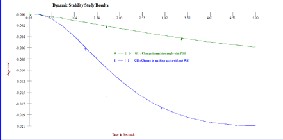
Fig-37: Variation in Machine angle in radians at Generator 1 (Time response up to 50 second)
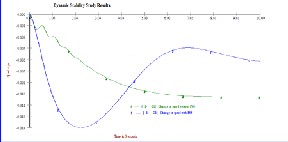
Fig-33: Variation in Machine speed in radians/sec at Generator 1 (Time response up to 50 second)
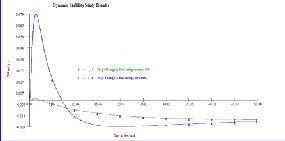
Fig-38: Variation in Machine angle in radians at Generator 1 (Time response up to 5 second)
Fig-34: Variation in Machine speed in radians/sec at Generator 1 (Time response up to 10 second)
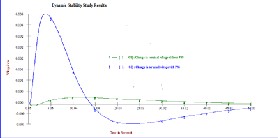
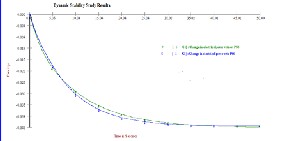 Fig-39: Variation in Machine Field voltage in pu at Generator 1
Fig-35: Variation in Machine Electrical power output in pu on
100MVA base at Generator 1(Time response up to 50 second)
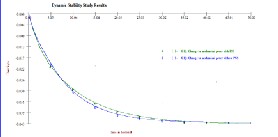
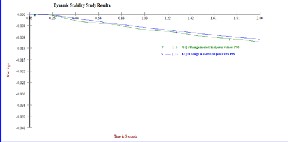 Fig-40: Variation in terminal voltage in pu at Generator 1
Fig-36: Variation in Machine Electrical power output in pu on
100MVA base at Generator 1(Time response up to 2 second)
Fig-41: Variation in mechanical power input to Generator 1
IJSER © 2014 http://www.ijser.org
International Journal of Scientific & Engineering Research, Volume 5, Issue 7, July-2014 703
ISSN 2229-5518
4.0 CONCLUSION
1. Step increase in generator reference voltage results decrease of generator speed. Without PSS, step increase in
generator reference voltage results low frequency electro- mechanical oscillations in generator speed. With PSS, oscillations in the generator speed are very low.
2. Step increase in generator reference voltage results increase of generator electrical power output. Without PSS, step increase in generator reference voltage results oscillations in generator electrical power output. With PSS, oscillations in the electrical power output are damped fast.
3. Step decrease in generator reference voltage results increase of generator speed. Without PSS, step decrease in generator reference voltage results low frequency electro-mechanical oscillations in generator speed. With PSS, oscillations in the generator speed are very low. Step decrease in generator reference voltage results increase of generator electrical power output. Without PSS, step decrease in generator reference voltage results oscillations in generator electrical power output. With PSS, oscillations in the electrical power output are damped fast. Step increase in generator reference power results increase of generator speed. With PSS, maximum shoot in speed is higher as compared to without PSS. With PSS, oscillations in the electrical power output damp out faster. Step decease in generator reference power results decrease of generator speed. With PSS, maximum deep in speed is higher as compared to without PSS. With PSS, oscillations in the electrical power output damp out faster.
REFERENCE
[1] P.Kundur, “Power system stability and control” New York: Tata McGraw-Hill, 1994.
[2] P.M Anderson and A. A. Fouad, “Power System Control and
Stability”, Volume- I, Iowa State University Press, Ames, Iowa,
1977.
[3] F.P.demello, C.Concordia, “Concepts Of Synchronous Machine Stability As Affected By Excitation Control,” IEEE Trans.On Power system and apparatus, Vol-PAS-88, No.4, April
1969, pp. 316-329.
[4] IEEE Committee Report: “Computer representation of excitation systems”, IEEE Trans., 1968, PAS-87, pp 1460-1464. [5] Heffron, W.G., and Phillips, R.A: “Effects of modern amplidyne voltage regulator on under-excited operation of large turbine generators”, AIEE Trans., 1952, PAS-71, pp. 692-697.
[6] Larsen, E.V. and D.A. Swann, "Applying Power System Stabilizers: Parts 1, 2 and 3", IEEE Transactions on Power Apparatus and Systems, Vol. PAS-1 00, pp. 3017-3041.
[7] Koessler, R.J., "Techniques for Tuning Excitation System Parameters", IEEE Transactions on Energy Conversion. Vol. EC3. No. 4, December 1988, pp. 785-791.
Appendix-1

BIOGRAPHIES

1. Mr. Bhuwan Pratap Singh has received his B. Tech degree in Electrical Engineering from Rajasthan Technical University, Kota in 2011. He is currently pursuing M.Tech. (Power System) from Suresh Gyan Vihar University, Jaipur (email: halobhuwan@gmail.com)

2. Dr. M. P. Sharma received the B.E. degree in Electrical Engineering in 1996 Govt. Engineering College, Kota, Rajasthan and M. E. degree in Power Systems in 2001 and Ph.D. degree in 2009 from Malaviya Regional Engineering College, Jaipur (Now name as MNIT). He is presently working as Assistant Engineer, Rajasthan Rajya Vidhyut Prasaran Nigam Ltd., Jaipur. He is involved in the system studies of Rajasthan power system for development of power transmission system in Rajasthan and planning of the power evacuation system for new power plants. His research interest includes Reactive Power Optimization, Power System Stability, Islanding of power system, reduction of T&D losses and protection of power system.(email:mahavir_sh@rediffmail.com)
3. Ms Vishu Gupta has finished her bachelor of science in Electrical Engineering (B.S.S.E) in 2009 and Master of Science in Electrical Engineering(M.S.E.E.) in 2012 from the University of Idaho, Mascow, Idaho, USA. She is currently working in Suresh Gyan Vihar University, Jaipur, India as an Assistant Professor in the department of Electrical Engineering. Research interest includes low power consumption in power electronics devices, embedded system application in power system and power electronics.
IJSER © 2014 http://www.ijser.org