International Journal of Scientific & Engineering Research, Volume 4, Issue 10, October-2013 1217
ISSN 2229-5518
A study on The Distribution of household Carbon
Dioxide Emission in a small town of C.G. India.
Sumita Nair , Associate Professor, B. I. T. Durg, C. G. India.
![]()
A survey of households from a small town of Chhattisgarh, India, was undertaken to determine householders’ attitudes to, and understanding of, the greenhouse effect. The study was conducted for lower and higher income group and found that the higher income group emits five times more CO2 than lower income group. Considering three household carbon dioxide emitters e.g. car (transportation), electricity and liquefied petroleum gas (LPG) use were computed and household actions which could reduce CO2 emissions were addressed. Carbon dioxide emissions from the three sources were examined for higher income group which results 4.7tonnes/year per household and 1.13 tonnes/year per person emission. Electricity was the largest contributor (2.40 tonnes/year), cars the next largest (1.70 tonnes/year) and gas third (0.23 tonnes/year) per household. Emissions varied considerably from household to household. There was a strong positive correlation between availability of economic resources and household CO2 output from all sources. Carbon dioxide production, particularly from car use, was greater from households, and numbers of children in the household had little effect on emissions. There were also some economics of scale for households containing more adults. To reduce carbon dioxide emission actual actions is to reduce car use and household cooling.
Keywords: Household emission, carbon dioxide, Greenhouse effect, higher income group, lower income group, transportation, electricity and liquefied petroleum gas.
————————————————————
the future to achieve the temperature threshold of 2 °C [21], 24],
[25], 26].It is widely believed that it is possible to reduce CO2
emissions sufficiently to achieve the 2 °C target without
More than half of the world’s population is living in cities and urbanization is transforming the global environment at unparalleled rates and scales [1], [2]. Cities are estimated to account for about 78% of total global greenhouse gas (GHG) emissions, but are also the loci for innovative solutions to reduce emissions [3], [4], [5], [6], [7], [8]. Household lifestyle has been recognized as a major driver of energy use and related GHG emissions besides technology efficiency [9], [10], [11], [12], [13], [14]. Carbon management in cities is increasingly focusing on individuals, households, and communities due to population growth and improved living standards of urban residents [14], [15], [16], [17], [18], [19]. A better understanding of urban residential consumption patterns in relation to urban system structure and processes, and their linkages to GHG emissions emission profiles, will enable cities to develop tailor-made planning and policy measures towards low carbon cities. It is now widely accepted that increasing atmospheric concentrations of greenhouse gases (GHGs) are responsible for increasing global temperatures that has resulted in the phenomenon known as climate change [20].The Intergovernmental Panel on Climate Change (IPCC) have indicated that the risk of severe climate change impacts will increase markedly with a temperature increase of 2 °C above preindustrial levels [21]. The current rate of global temperature increase is between 0.2 and 0.3 °C/decade [21]. However, for there to be a high degree of certainty that the global temperature increase will be limited to 2 °C CO2 equivalent (CO2e) concentrations will have to be stabilized at levels of between 400 and 450 ppm CO2e [22], [23], [21], [24]. The current level is 430 ppm CO2e and is rising by more than 2 ppm/annum [25]. Delaying action to stabilize CO2e concentration levels will require increasingly greater action in
destabilizing the global economy by rapidly implementing
strong deliberate policy choices [25].
Three elements of policy are required for an effective global response: (i) The pricing of carbon, implemented through tax, trading or regulation; (ii) The support of innovation and the deployment of low carbon technologies; and (iii) The removal of barriers to energy efficiency, and to inform, educate and persuade individuals about what they can do to respond to climate change [25].
For planning effective policies in the future an accurate and
equitable method of calculating household and personal CO2eemissions is required. There are two main approaches to calculate carbon footprints: top-down and bottom-up methods. While the former is based on input-output data and generally useful for sector level or country level analyses, the latter is based on life-cycle analysis that accounts for emissions of individual items from cradle to grave. For large entities and institutions, it is usually necessary to integrate the two methods for a more comprehensive carbon accounting analysis.
India being the world’s fourth largest carbon dioxide polluter accounts for 7% of total carbon emissions in 2011. Sector wise
annual GHG emission shows that electricity generation (21.3%), industrial processes (16.8%) and transportation fuel (14%) are the major sectors contributing primarily to GHG.
The main drivers of these emissions have been (1) the growing expenditures per capita, (2) population and (3) increasing energy intensity in the food and agricultural sectors. Household energy requirements have increased significantly, both in total and per
IJSER © 2013 http://www.ijser.org
International Journal of Scientific & Engineering Research, Volume 4, Issue 10, October-2013 1218
ISSN 2229-5518
capita terms over this time period. In this paper, we focus on household energy consumption. In the U.S., the household carbon emissions account for 40 percent of total carbon emissions, while in China this share is less than twenty percent. However, the household’s share of total per-capita carbon emissions will surely grow as China transitions from being a manufacturing economy to being a service economy. As domestic households become richer they will consume more electricity and the demand for private transportation services will increase.
As of the 2001 India census the population is 52% male and
48% female. Bhilai Nagar has an average literacy rate of 90%,
higher than the national average of 59.5%.Bhilai is a city in the
Durg district of Chhattisgarh, in eastern central India. This place
is situated in Durg, Chattisgarh, India, its geographical coordinates are 21° 13' 0" North, 81° 26' 0" East.The city is located
25 kilometres west of the capital Raipur, on the main Howrah– Mumbai rail line, and National Highway 6. Bhilai is famous for the Bhilai Steel Plant, which is the largest steel plant in India and
known for being the only manufacturer of rails in the country used by Indian Railways. Junwani is a small town located in Bhilai from where the samples were collected.
The greenhouse gas emission can be defined as the carbon footprint. A carbon footprint can broadly be defined as a measure of the greenhouse gas (GHG) emissions that are directly and indirectly caused by an activity or are accumulated over the life stages of a product or service, expressed in carbon dioxide equivalents [ 27]. A carbon footprint is a measure of an individual's contribution to global warming in terms of the amount of greenhouse gases produced by an individual and is measured in units of carbon dioxide equivalent [28]. It is made up of the sum of two parts, the direct or primary footprint is a measure of our direct emissions of CO2e from the burning of fossil fuels including domestic energy consumption and transportation (e.g. car and plane); and the indirect or secondary footprint is a measure of the indirect CO2e emissions from the whole lifecycle of products and services we use including those associated with their manufacture and eventual breakdown [29]. There is increasing awareness of an individual's behavior or lifestyle as a source of global carbon emissions [30]. The calculation of individual and household carbon foot prints is a powerful tool enabling individuals to quantify their own carbon dioxide emissions and link these to activities and behavior. Such models play an important role in educating the public in the management and reduction of CO2 emissions through self- assessment and determination. Carbon emission models may possibly be used in the future as a tool to calculate carbon taxes, the allocation of carbon units and the basis for personal carbon trading [31]. Today, per capita carbon emissions in the United States are about ten time’s per capita emissions in India and five times in china, which implies that if India’s per capita greenhouse gas emissions rose to U.S. Levels, then global carbon emissions would double. While forty percent of U.S. emissions are associated with residential and personal transportation a much smaller share of Chinese emissions come from these sectors. China’s urban development policies could have large
potential impacts on global carbon emissions. In this paper, we calculate household carbon emissions using several data sources including the Urban Household Survey. This survey provides information on energy usage for 100 households of a small town in C.G. in India. Relative to U.S households, transportation represents a smaller share of Chinese urban household emissions and household heating represents a much larger share. Being a developing country of the world we can expect the same trend in India.
Carbon footprint models or calculators are widely available on the Internet. Existing models calculate the individual or household primary footprint by converting the amount of electricity, oil, gas or coal used per year into CO2 emissions. They also convert the number of kilometres driven in a car, kilometres on various types of public transport and air kilometres to CO2 emissions. Models or calculators are provided by a range of organizations including government agencies, non- governmental organizations (NGOs) and private companies. The model used for carbon emission calculation in this study is as follow:
We focus on three major household sources of carbon dioxide
emissions; transportation, residential electricity consumption
and domestic fuel. The following equation provides an
accounting framework for organizing our empirical work.
Total Emissions = γ1*Transportation +γ2*Electricity +
γ3*Domestic Fuel (1)
Our main goal is to estimate equation (1) for lower and higher
income group household. In this equation, transportation
represents energy use from a vector of activities including litres of annual gasoline consumed for households that own a car. We recognize that households consume other products (such as what they eat) that have carbon consequences but those are not included in this calculation. To estimate carbon dioxide emission by transportation the mean annual consumption of the family is multiplied by defra emissions factor vector defined as γ1. For example, each litre of gasoline consumed produces 2.3117
KgCO2e of carbon dioxide.The second term in this equation represents carbon dioxide emissions from residential electricity
consumption. In the U.S., Glaeser and Kahn [32] found tight link between electricity consumption and hot summers, presumably because of extensive use of air conditioning. To convert electricity usage into carbon emissions, the average annual consumption of electricity in Kwh is multiplied by γ2, which is defra conversion factor. The value of γ2 is 0.5246 Kg CO2e per unit of electricity consumed in Kwh. The third term in the equation is emissions from domestic fuels. This term includes liquefied petroleum gas (LPG) used for cooking. In contrast to Coal, LPG is expensive and less carbon intensive. To convert LPG usage to carbon emissions, the average annual consumption of LPG in Liters are multiplied by γ3. The value of γ3 is 1.4918
Kg CO2e per Liter of LPG consumed.
These conversion factors are produced by the UK Government to help companies calculate greenhouse gas
IJSER © 2013 http://www.ijser.org
International Journal of Scientific & Engineering Research, Volume 4, Issue 10, October-2013 1219
ISSN 2229-5518
emissions from a range of activities, including energy use and transport activities. These conversion factors convert activity data (e.g. litres of fuel used, tonnes of waste sent to landfill) into kg of CO2 equivalent (CO2e) (Table 1).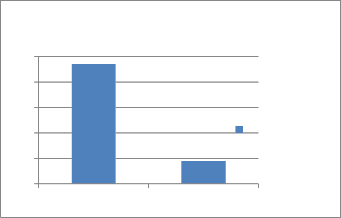
requirements across households. In this study for lower and higher income group the total household carbon emission is shown in fig.1.

Table 1: DEFRA 2011conversion factor (2011)
Source Unit Kg CO2 e per Unit
Electricity KWh 0.5246
5.0
4.0
3.0
2.0
1.0
0.0
Higher Lower
Total Emission
LPG L 1.4918
Petrol L 2.3117
Diesel L 2.6676
The data collected were analysed to calculate the household carbon emission. Basically the study was carried out to analyse the household carbon emission distribution. Different factors were considered which account for the household carbon emission but in this study the factors which are considered are the electricity, LPG and Petrol which contribute a lot for the household emission. For this study the samples were classified into two categories the lower and the middle income group. The lower income group was in the income range of Rs. 1, 00000 – 5,
00000/- and the higher income group was in between Rs. 15,
00000 – 20, 00000/-. For household emission the emission from
different sources like electricity, LPG and Petrol were collected.
Earlier carbon footprints for Indian households have been
calculated by Parikhet al. [33]. Their paper presents differences in consumption patterns across income groups and their carbon dioxide implications. A main finding is that the rich have a more carbon intensive lifestyle with the urban emission levels being 15 times as high as those of the rural poor [33]. Apart from carbon footprints, closely related energy requirements of Indian households have been calculated by Pachauri&Spreng[34] for the years 1983-84, 1989-90 and 1993-94. Based on IO-analysis, they find that household energy requirements have significantly increased over time identifying growing income, population and increasing energy intensity in the food and agricultural sectors as the main drivers. Based on this analysis, Pachauri&Spreng[34] present cross-sectional variations in total household energy requirements. Using household consumption expenditure data for 1993-1994 matched with energy intensities calculated by Pachauri&Spreng[34], an econometric estimation reveals income levels as the main factor determining variation in energy
Fig. 1Ttotal household carbon emission for lower and higher income groups.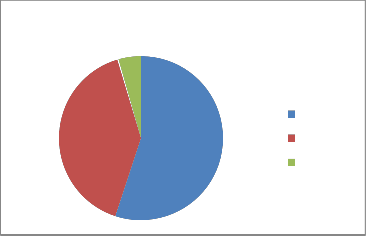
The total carbon emission for higher income group is approximately five times higher than the lower income group. The average total emission of higher income group is 4.7 T CO2 e per year while that of lower income group is 0.9 T CO2e per year. To examine the difference between these two values the detailed data were analyzed for contribution of different sources. The result of carbon emission from different sources for higher and lower income group is shown in Fig. 2, 3.
Electricity
Petrol
LPG
Fig 2 .The distribution of different sources in total emission for higher income group.
IJSER © 2013 http://www.ijser.org
International Journal of Scientific & Engineering Research, Volume 4, Issue 10, October-2013 1220
ISSN 2229-5518
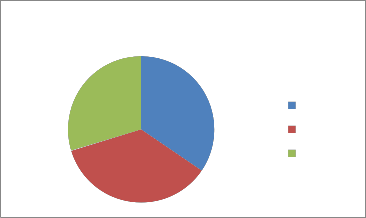
Electricity
Petrol
LPG
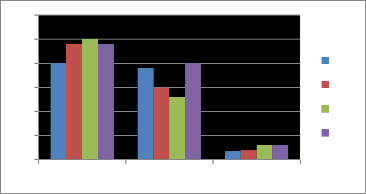
For this study the different adult child ratio were collected, like family with two adults and two children, two adults and one child, Three adults and two children, Three adults and one child and Four adults and one child. This study was carried out to analyse whether the varying child adult ratio can affect the total household carbon emission. The total emission for the first three adult child ratios is more or less same. While the total emission increases for four adult and one child ratio. For these adult child ratios the detailed data are also collected to check whether the different emission sources also differs or have the same emission pattern.
3
2.5
Fig3. The distribution of different sources in total emission for lower income group.
It is clear from the fig. 2 and 3 that the electricity and petrol consumption for higher income group are larger as compared to lower income group while there is only marginal difference between these groups for LPG consumption. The reason for higher electricity consumption could be the use of more
2
1.5
1
0.5
0
Electricity Petrol LPG
2+1
2+2
3+2
4+1
electrical appliances like AC, TV, Geyser, Kitchen appliances and
for higher petrol consumption may be the high use of petrol cars
for daily transportation while the lower income group generally
uses bicycle or two wheelers for travelling. The local transport means are not included in the study because this study concerns only the household consumption while the long distance transportation like train, flight and bus are not included. The LPG consumption is more or less same for both the groups because of improving life style in rural areas but this could not be same for poor income group due to high use of wood for cooking.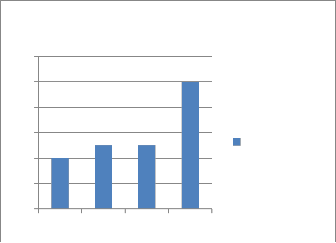
Further the study was conducted to evaluate the effect of number of members in the family on the carbon emission of higher income group families. The results are shown in Fig. 4.
4.8
4.6
4.4
4.2
Total emission
4
3.8
3.6
2+1 2+2 3+2 4+1
Fig 4 .Effect of number of members in the family on the carbon emission of higher income group families.
Fig 5.Effect of no.Of family members on different emission sources.
From the study it is clear that electricity consumption is highest for family with three adults and two children but petrol consumption is high for 4+1 family and LPG consumption is same for 4+1 and 3+2 family (Fig. 5). So it can be concluded that the numbers of children in the household had little effect on emissions. There were also some economics of scale for households containing more adults. To reduce carbon dioxide emission actual actions is to reduce car use and household cooling. The average per capita carbon dioxide emission per anum for higher income group of this study is 1.13 T CO2e while the per family carbon dioxide emission per anum for higher and lower income group are 4.7 T CO2e and 0.9T CO2e respectively.
This was a small case study representing the household carbon dioxide emission pattern with average carbon footprint of 4.7 T CO2e for higher income group. The emission pattern indicates that for higher income group the total carbon emission was highly influenced by high electricity and petrol consumption. While LPG consumption is un affected by income groups. It is anticipated, from the findings of this study, that CO2 emissions can be reduced by reducing fossil-fuel consumption and switching to alternative energy sources, preserving existing forests, planting trees on abandoned and degraded forest lands, or by planting trees by social/agro forestry on agricultural lands. Preliminary analysis of the results
indicates that householders in this area are aware of, and concerned about, the greenhouse effect, although their understanding of its causes is often poor. Many appreciate the
contribution of cars, but are unclear about the relative importance of other household activities. To develop tailor-made planning and policy measures towards low carbon cities these
IJSER © 2013 http://www.ijser.org
International Journal of Scientific & Engineering Research, Volume 4, Issue 10, October-2013 1221
ISSN 2229-5518
results could be beneficial because these results indicate the high household emission through electricity and petrol use. The promoted use of renewable energy resources and felicitating the use of public transport could be beneficial to reduce these values.
[1] Seto KC, Fragkias M, Güneralp B, Reilly MK (2011) A meta-analysis of global urban land expansion.PLoS ONE 6: e23777. doi:
10.1371/journal.pone.0023777.
[2] Grimm NB, Faeth SH, Golubiewski NE, Redman CL, Wu JG, et al. (2008) Global change and the ecology of cities. Science 319: 756–760. doi:
10.1126/science.1150195.
[3] Pataki DE, Alig RJ, Fung AS, Golubiewski NE, Kennedy CA, et al. (2006) Urban ecosystems and the North American carbon cycle. Global Change Biology 12: 2092–2102. doi: 10.1111/j.1365-2486.2006.01242.x.
[5] Kennedy C, Steinberger J, Gasson B, Hansen Y, Hillman T, et al. (2010) Methodology for inventorying greenhouse gas emissions from global cities. Energy Policy 38: 4828–4837. doi: 10.1016/j.enpol.2009.08.050.
[6] Lin J, Cao B, Cui S, Wang W, Bai XM (2010) Evaluating the effectiveness of urban energy conservation and GHG mitigation measures: The case of Xiamen City, China. Energy Policy 38: 5123–5132. doi:
10.1016/j.enpol.2010.04.042.
[7] Dhakal S (2010) GHG emissions from urbanization and opportunities for urban carbon mitigation. Current Opinion in Environmental Sustainability 2: 277–283. doi: 10.1016/j.cosust.2010.05.007.
[8] Kaye JP, Groffman PM, Grimm NB, Baker LA, Pouyat RV (2006) A
distinct urban biogeochemistry? Trends in Ecology and Evolution 21: 192–
199. doi: 10.1016/j.tree.2005.12.006.
[9] Lenzen M, Cummins RA (2011) Lifestyles and well-being versus the environment. Journal of Industrial Ecology 15: 650–652. doi: 10.1111/j.1530-
9290.2011.00397.x.
[10] Bai XM, Dhakal S, Steinberger J, Weisz H (2012) Drivers of urban energy use and main policy leverages. In: Grubler A, Fisk DJ editors. Energizing sustainable cities.EarthScan.
[11] Weisz H, Steinberger JK (2010) Reducing energy and material flows in cities. Current Opinion in Environmental Sustainability 2: 185–192. doi:
10.1016/j.cosust.2010.05.010.
[12] Schipper L, Bartlett S, Hawk D, Vine E (1989) Linking life-styles and energy use: a matter of time? Annual Review of Energy 14: 273–320. doi:
10.1146/annurev.energy.14.1.273.
[13] Wei Y, Liu L, Fan Y, Wu G (2007) The impact of lifestyle on energy use and CO2 emission: An empirical analysis of China's residents. Energy Policy 35: 247–257. doi: 10.1016/j.enpol.2005.11.020.
[14] Jones CM, Kammen DM (2011) Quantifying carbon footprint reduction opportunities for US households and communities. Environtal Science and Technology 45: 4088–4095. doi: 10.1021/es102221h.
[15] HM Government (2006) The UK climate change programme 2006. London, UK: The Stationery Office.
[16] Dietz T, Gardner GT, Gilligan J, Stern PC, Vandenbergh MP (2009) Household actions can provide a behavioral wedge to rapidly reduce US
GHG emissions. Proceedings of theNational Academy of Sciences 106:
18452–18456. doi: 10.1073/pnas.0908738106.
[17] Druckman A, Jackson T (2009) The carbon footprint of UK households 1990–2004: A socio-economically disaggregated, quasi-multi- regional input-output model. Ecological Economics 68: 2066–2077. doi:
10.1016/j.ecolecon.2009.01.013.
[18] Wang Y, Shi M (2009) CO2 emission induced by urban household consumption in China. Chinese Journal of Population, Resources and Environment 7: 11–19.
[19] Feng L, Lin T, Zhao Q (2011) Analysis of the dynamic characteristics of urban household energy use and GHG emissions in China. China Population, Resources And Environment 21: 93–100.
[20] IPCC. Climate Change (2007): The Physical Science Basis — Summary for Policy Makers;2007. http://www.ipcc.ch/SPM2feb07.pdf (accessed 20 March '07).
[21] EPA.(2006) Implications of the EUClimateProtectionTarget for Ireland.EnvironmentalProtectionAgency. Wexford: Johnstown Castle;2006. research/climate/erc%20report%205.pdf (accessed 21 September 2007a).
[22] CEC. Winning the Battle against Global Climate Change.Communication from the Commission to the Council, the European Parliament, the European Economics andSocial Committee and the Committee of the Regions.COM (2005)35 Final.Brussels:Commission of the European Communities; 2005.
climate_change/stern_review_report. Cfm (accessed 20 March 2007).
[23] Meinshausen M. On the Risk of Overshooting 2 °C.Paper presentedat
ScientificMeteorological Office; 2005.
[24] Bows A, Mander S, Starkey R, Bleda M, Anderson K. Living within a carbon budget.Tyndall Centre. Manchester: University of Manchester; 2006.
[25] Stern N. Stern Review: The Economics of Climate Change. London: HM Treasury; (2006).http://www.hmtreasury.gov.uk/independent_reviews/stern_review
_economics_Symposium Avoiding Dangerous Climate Change. 1–3
February 2005.
[26] EPA. National Inventory Report 2007: Greenhouse Gas Emissions
1990–2005 Reportedto the United Nations Framework Convention on
Climate Change; 2007b. http://coe.epa.ie/ghg/nirs/NIR_2007_IE.pdf
(accessed 29 June 2007).
[27] Wiedmann, T., Barrett, J. and Lenzen, M. (2007)."Companies on the
Scale - Comparing and Benchmarking the Footprints
of Businesses". International Ecological Footprint Conference, May 8-10,
2007, Cardiff, UK.
[28] Lynas M. Carbon Counter. Glasgow: HarperCollins Publishers; 2007. [29] Tukker A, Jansen B. Environmental impacts of products — a detailed
review of studies.J. Ind. Ecol. (2006) ;10:159–82.
[30] Bin S, Dowlatabadi H. Consumer lifestyle approach to US energy use and the related CO2emissions. Energy Policy (2005) ;33:197–208.
[31] O'Donoghue C. Carbon Dioxide, Energy Taxes and Household
Income. Dublin: TheEconomic and Social Research Institute; 1997.
[32] Glaeser, Edward L. & Kahn, Matthew E., 2010. "The greenness of cities: Carbon dioxide emissions and urban development," Journal of Urban Economics, Elsevier, vol. 67(3), pages 404-418, May.
[33] Parikh, J., Panda, M. & Murthy, N.S., 1997. Consumption patterns by income groups and carbon-dioxide implications for India: 1990-2010. International Journal of Global Energy
Issues, 9(4-6), pp.237–255.
IJSER © 2013 http://www.ijser.org
International Journal of Scientific & Engineering Research, Volume 4, Issue 10, October-2013 1222
ISSN 2229-5518
[34] Pachauri, S. &Spreng, D., 2002. Direct and indirect energy requirements of households in India. Energy policy, 30(6), pp.511–523.
[35] Defra.Guidelines for Company Reporting on Greenhouse Gas Emissions Annexes updated August 2011. London: UK Department for Environment, Food and Rural Affairs;
2011.http://www.defra.gov.uk/environment/business/envrp/pdf/envrpg as-annexes.pdf.