International Journal of Scientific & Engineering Research, Volume 3, Issue 10, October‐2012 1
ISSN 2229‐5518
A Study on Hubbert Peak for Natural Gas of
Bangladesh: A System Dynamics Approach
Saifullah Al Yusuf, Sabuj Das Gupta, Shuva Paul, Md. Shahinur Islam, Sudip Majumder
—————————— ——————————
Abstract— M. King Hubbert, an American geophysicist, in 1956 introduced a logistic equation for the estimation of USA peak and lifetime. As a case study, this paper investigates the Hubbert peak for Natural Gas production of Bangladesh. In this work, the authors have adopted system dynamics methodology to examine the Hubbert peak for Bangladesh's Gas production. Results show that the peak will occur in the 2012 with a value of 2184550 million cubic foot which is about 3 times of the 2011 year production. The proposed model helps us to evaluate different scenarios as well as performing sensitivity analysis which give us informative and useful forecasts about the time and value of Hubbert peak in different conditions. Thus, it is useful for Bangladeshi and international energy policy makers to understand the forthcoming shortage in the world's energy supply. Since this is the first study of Hubbert peak for Bangladesh, comparison with previous forecasts about this peak is not possible in this study.
Index Terms - Hubbert Peak, Natural Gas, Bangladesh, Energy, Oil, renewable.
in 2009 [2] Bangladesh is 2nd in world textile exports, and
Bangladesh, with its emerging commerce and industries, is facing a daunting task to cope up with the power crisis. Bangladesh being a developing country, the economy is heavily dependent on the Energy sector via industries. The boom in the economy can only brought by the reforms in energy sector. The country being an under developed one suffers from many of the basic need that most countries usually have. It has a per capita income of US$1,700 in 2010. According to the International Monetary Fund, Bangladesh ranked as the 43rd largest economy in the world in 2010 in PPP terms and 57th largest in nominal terms, Bangladeshʹs energy infrastructure is quite concise due to the face of insufficient and poor management. Only 40% to 48% of the population has access to electricity. The per capita energy consumption in Bangladesh is between 218‐230 kWh which is considered to be the lowest in the world. GDP by sector agriculture: 18.4%, industry: 28.6%, services: 53% (2011 est.) Many new jobs ‐ mostly for women ‐ have been created by the countryʹs dynamic private ready‐made garment industry, which grew at double‐digit rates through most of the 1990s [1]. By the late 1990s, about 1.5 million people, mostly women, were employed in the garments sector as well as Leather products specially Footwear (Shoe manufacturing unit). During 2001‐2002, export earnings from ready‐made garments reached $3,125 million, representing 52% of Bangladeshʹs total exports. Bangladesh has overtaken India in apparel exports in 2009, its exports stood at 2.66 billion US dollar, ahead of Indiaʹs 2.27 billion US dollar Bangladeshʹs textile industry, which includes knitwear and ready‐made garments along with specialized textile products, is the nationʹs number one export earner, accounting for 80% of Bangladeshʹs exports of $15.56 billion
China which exported $120.1 billion worth of textiles in
2009. The industry employs nearly 3.5 million workers. Current exports have doubled since 2004. Wages in Bangladeshʹs textile industry were the lowest in the world as of 2010. The country was considered the most formidable rival to China where wages were rapidly rising and currency was appreciating. In this present scenario, the economy must be supported by the energy sector for sustainable development. Unfortunately, there is a lack of sufficient power generation capacity and the existing national grid network is unable to power the whole nation. The demand for power is increasing at a rapid pace although the generation of power has not increased at the same proportion. The gap between demand and supply of power is quite significant. While majority share of the power plants are gas fired, the country is also suffering from gas shortage. The other power plants, most of them are oil fired and Bangladesh has to rely on the international market for this fuel. As a result, how long our gas supply will last has been a burning question now. In this paper, we have explored the potential life of gas supply with different sensitivity analysis considering different ultimate reserve. We considered different ultimate reserves because, Bangladesh has got two more blocks in the Bay of Bengal in
2012 and it has potential to get gas field over there. For all these issues prediction over gas production peak value and time has become the most important issue for Bangladesh. Hubbert peak could be used to estimate this.
In 1956, M. King Hubbert predicted that U.S. oil
production would peak in the early 1970ʹs and in 1971
Hubbertʹs prediction came true [3]. The production of oil
appears to have gradual increase to a maximum output, then a long plateau and finally a slow decrease. This forms
IJSER © 2012 http://www.ijser.org
International Journal of Scientific & Engineering Research, Volume 3, Issue 10, October‐2012 2
ISSN 2229‐5518
a curve which is called Hubbert Curve. This is done by placing a small number of small fields at the beginning a large number of small fields at the end. Hubbert argued that the following logistic equation can be used to estimate oil production:
P = aQ(1− Q / R) (1)
Where P identifies the annual production of oil, ‘Q’ identifies the cumulative production which can be calculated from P, and R is the cumulative production after all recoverable oil has been produced. ʺaʺ is a parameter which is called intrinsic growth rate.
This equation can be also written as
P /Q = a − aQ / R (2) Or
P /Q = a − mQ (3)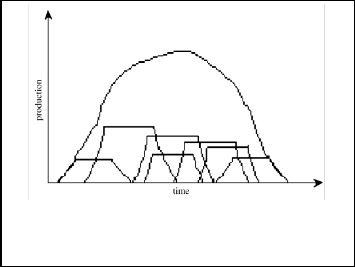
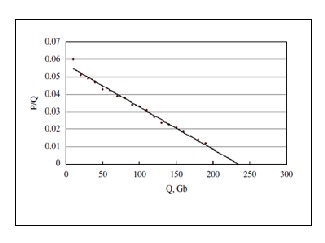
In equation (3), the parameter “mʺ shows the production of oil (a / R). Figures below show the estimation of US production. Only problem here is the values of ‘a’ and ‘m’ are ambiguous found using statistical regression for accuracy. So there is no exact value. But so far this technique is the best way to estimate the peak value of natural resources.
Fig. 1. Hubbert Curve.
Fig. 2. Estimation of US production.
In this paper a system dynamics approach is used to examine the Hubbert peak for Natural Gas production of Bangladesh. In section 2, the related literature of system dynamics with the reason why it is used in order to study the Natural Gas production outlook, is explained. In section
3 a system dynamics model for Natural Gas of Bangladesh is proposed. The model is simulated for 110 years and the results are illustrated. The value of this simple model is to help researchers in scenario building and sensitivity analysis. Here two types of sensitivity analysis have been generated. At first, the variation in Hubbert peak due to Ultimate reserve is figured out and then for different intrinsic growth rate. Thus, it offers more informative results for better energy policy decisions.
System dynamics or SD is a model set up to understand the dynamic behavior of complex system .It was introduced by J.W Forrester in the mid 1950s at the Massachusetts Institute of Technology (MIT). With background knowledge of electric circuits, servo‐mechanism theory and feedback control theory, he developed powerful methods and a set of tools to modeling and analyzing problems in complicated situation by using some variables. SD prides itself on combining human mind and the power of computers in order to overcome the barriers to learning such as dynamic complexity, limited information of problem situation, confounding variables and ambiguity, bounded rationality, flawed cognitive maps, erroneous inferences about dynamics, and judgmental errors.
In this paper the SD methodology and use it to
achieve a realistic and reflective system forms for a greater understanding of the target system.
To under situation and nature of problem and factors associated with it and a relationship of the factor with the cause of the problem.
IJSER © 2012 http://www.ijser.org
International Journal of Scientific & Engineering Research, Volume 3, Issue 10, October‐2012 3
ISSN 2229‐5518
Development of a simulation model based on the explicit conceptual model via a causal diagram to develop the understanding of influence of the variables on each other explicit concepts of SD such as flows, levels and auxiliary are used in simulation model building process.
Successful effectiveness of the model of simulation
there exist a higher possibility to analyze different scenarios of the policy to come up with the most effective and best suit decision.
However the country under investigation is a newly born one and the data recoverable were not in excess since the data were not retained from the very first after the countries liberation.
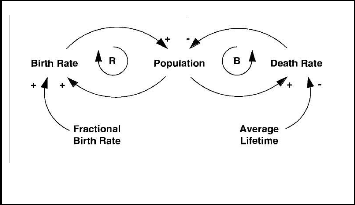
Causal loop diagram shows a clear relation between the cause and effect. It is an important feature for representation of the feedback structure of a system. A causal diagram is built of variables connected by arrows visualizing the causal influences among the variables and positive and negative polarities to indicate any increase and decrease on any system variable .A simple example of Causal Loop.
Fig. 3. Causal Loop Diagram.
The relationships between variables are established by causal link indicated by arrow. Here the population is the cause affected by two values the birth rate and fractional birth rate. The positive “+” and the negative mark “‐” draws a relationship between the dependent and independent variables the effect of change on the previous one on the latter. The function of the loop identifier is to show whether the loop is reinforcing or balancing .The “+” usually implements that the increase in cause will have the effect in its favors in an excess quantity. The “‐” means an
inverse relation between the cause and effect in the same context.
Despite the fact that CLD causes an improved communication and comprehensiveness between users, two more major variables of concern for stimulating all elements in the system these are the level and the rate. The level refers to a given element with in a specific time interval the total reserve or population of an inventory at January 2012 Where as the rate reflects the extent system behavior as the hourly production of the element to the daily rate of consumption. The relation between level and rate is such that a difference between the rate variable will affect the level of the commodity and of course time is the main player.
Bangladesh has energy supply especially from fossil fuel sources and a less extent of, renewable sources. However, almost 70 percent of commercial energy is provided from natural gas. Currently, the country is suffering from a shortage of 500MMCF gas production per day. Natural gas has become the prime fuel source for electricity generation in Bangladesh. But electricity sector is not only the sector that are demanding natural gas as a fuel but, other existing sectors like fertilizer, industry, transport and residential sectors are also in need of it. This indicates the foundation of national economy is dependent on natural gas in many ways. Hence a condense analysis on the reserve, availability and proper use of natural gas need to be conducted before escalating new gas consumers.
A conservative estimate of sector wise allocation of gas (In
Billion cubic feet) is shown below. This table indicates the demand for natural gas is in every sector while, power sector is the dominant participant. At present it has been a common scenario that many publicly owned power plants are suffering from outage because of the insufficient fuel supply. In the year 2011, the Power Development Board (PDB) had to suspend operation of a huge number of its generation units having a total of 700‐MW production capacity on account of gas shortages [4]. Moreover, exploring and discovering gas is a capital intensive and risky investment. It needs an investment of approximately BDT 700 core for discovering a gas field, whereas the rate of success is only 20‐25 percent [5]. Petrobangla chairman Dr. Hussain claimed the following about the gas crisis in the country, “During the last three years gas production capacity has increased by 505 MMCFD while, actual production was raised by 320 MMCFD. During the same
IJSER © 2012 http://www.ijser.org
International Journal of Scientific & Engineering Research, Volume 3, Issue 10, October‐2012 4
ISSN 2229‐5518
period, production at different gas fields has reduced by
185 MMCFD for obvious reasons. He projected that the
countryʹs demand for gas will go up to 3,043 million cubic feet per day (MMCFD) by July 2012 and 3,341 MMCFD by July 2013 from the present demand of 2,500. At present, the highest total gas production is 2067.4 MMCFD from 18 gas fields while shortage is more than 436 MMCFD. The countryʹs power sector operators not to be hopeful of getting adequate gas supply to feed their power plants planned to be installed by 2015.” [6].
Table I. Gas consumption by different sectors in
Bangladesh.
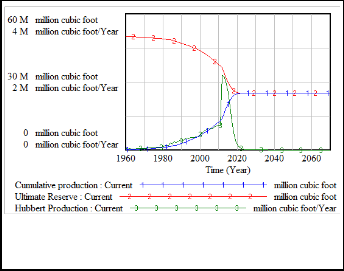
Fig.4. Natural Gas Production in Millions of Cubic Foot per year. Source: According to Petrobangla’s estimate and [11].
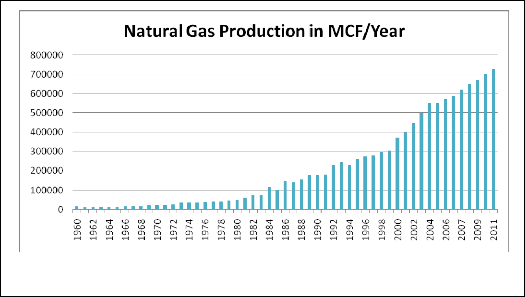
This above graph gives us the information about the
rocketing production of natural gas in Bangladesh which eventually leads questions about its future reserve. The
problem is very damaging to the social life, transport
sector, industry and power sector. A pie chart illustrating
IJSER © 2012 http://www.ijser.org
International Journal of Scientific & Engineering Research, Volume 3, Issue 10, October‐2012 5
ISSN 2229‐5518
the natural gas consumption by different sector is given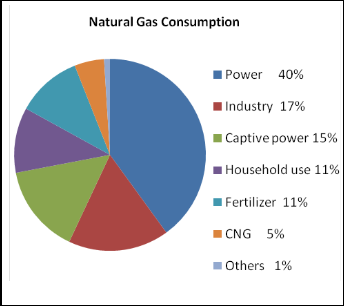
below.
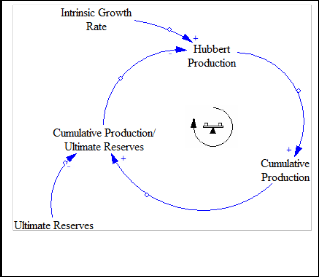
Fig.5. Natural gas consumption by different sectors.
Apart from the electricity industry, the fertilizer sector is
also suffering from the gas shortage. The Karnaphuli Fertilizer Company Ltd (Kafco) and Chittagong Urea Fertilizer Ltd (CUFL) were shut down on April 2nd’2010 while, three other factories (Palash (Ghorasal) Fertilizer Factory, Jamuna Fertilizer Factory and Zia Fertilizer Factory) were on the process of closing down [7]. There are a lot of reasons behind this shortage including Government’s failure to find new gas fields, the extraction process is very lengthy & ultimate reserve is decreasing day by day. One of the country’s largest gas filed known as
‘Sangu’ gas field is almost at its end having its daily
production only 3MMCFD [8]. The situation of ‘Char Kajol’ brought more agony for the government. It was expected to get at least 500MMCFD from there while after drilling US oil giant Chevron has found the prospect of finding gas at
‘Char Kajol’ in block‐7 to be almost zero [9]. Residential and
transport sector are also not free from this anguish. Many families in the Dhaka city are not getting adequate gas supply for their cooking purpose. Again, CNG is at present being used by around 200,000 vehicles. As much as 110 million cubic feet gas per day (MMCFD), roughly one‐ twentieth of the countryʹs gas demands, are being sold per day [10]. Government has now forced to assign a time table, on which the gas pumps will remain closed from supplying CNG to the transports. All these issues clearly suggest there is a serious lack of natural gas and it will not last long. It is high time to figure out the hubbert peak for the natural gas production of Bangladesh and eventually it will help the policy makers to take robust decisions to shift the energy sector fuel structure.
Fig. 6. Causal loop Diagram of Hubbert Peak.
A time horizon of 110 years is defined to show the history of Natural gas production of Bangladesh production and its changes in the future. Two levels have been developed in this model, (1) Ultimate Reserve and (2) Cumulative Production. The Ultimate Reserve does not have any inflows. This is because gas is created in geologic time. Thus, for all practical purposes, the total amount of Natural Gas is assumed to be constant. The Ultimate Reserves are conducted into the Cumulative Production with the rate of Hubbert production which is affected by the intrinsic growth rate. Based on Natural Gas of Bangladesh data, the intrinsic growth rate is 0.128. The historical data for natural gas are added with lookup variable which are named NG lookup. The data is obtained from a research paper named “Natural Gas Options for Bangladesh” which is published by the center for policy research of International University of Business Agriculture and Technology [11]. The modelʹs equations are given in the Appendix.
The model shows that Natural Gas production of
Bangladesh will reach its peak in 2012 with 2184550 million cubic foot/year as shown in figure 6. This model is free from all type of policies. One assumption is considered in this regime that, the total consumption will decrease at a rate of 2% from year 2011. This assumption is made because
IJSER © 2012 http://www.ijser.org
International Journal of Scientific & Engineering Research, Volume 3, Issue 10, October‐2012 6
ISSN 2229‐5518
of the present scenario of Natural gas production in
Bangladesh. There are some gas wells drying out and it has been quite long that any new wells are discovered. Data has been always a massive problem for this type of analysis. It has been a great challenge to figure out the ultimate reserve of natural gas in Bangladesh. Different source came out with different values and they all do have their own argument for supporting this value. In this system the ultimate reserve is considered as 50BCF according to [11]. For these set of data the intrinsic growth rate has been calculated in the following fashion.
Intrinsic Growth rate, a = ln[N(t2)/N(t1)]/(t2 ‐ t1) (4)
Here N(t2) is the consumption quantity of natural gas in the final year of the given set of data and N(t1) is the consumption quantity of natural gas in the initial year. After the calculation this value came 0.256. The system dynamics of natural gas of Bangladesh is given below.
Fig. 8. Hubbert Peak, Cumulative production & Ultimate reserve of Natural Gas of Bangladesh.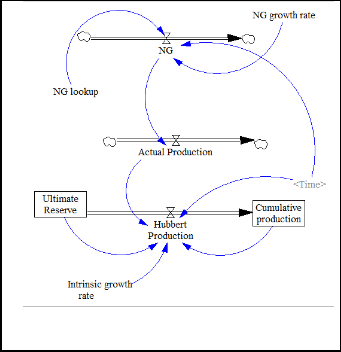
Fig. 9. Forecasted Natural Gas Consumption of Bangladesh.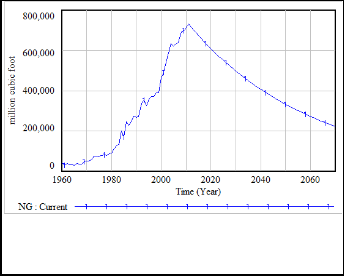
TABLE II
SIMULATION RESULTS OF HUBBERT PRODUCTION
RATE AND CUMULATIVE PRODUCTION
Fig.7. Stock‐flow Diagram of Hubbert Peak.
The behavior of the model is important and informative under some scenarios as implemented in this paper. Ultimate Reserve and the Intrinsic Rate are the very difficult to figure out for a range of time. There is a big disparity in these values from source to source. Hence, in
IJSER © 2012 http://www.ijser.org
International Journal of Scientific & Engineering Research, Volume 3, Issue 10, October‐2012 7
ISSN 2229‐5518
the analysis of natural gas production, first scenario is
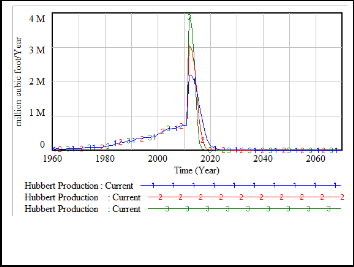
about Ultimate Reserves (UR). Three different amounts are used for UR 60TCF, 50TCF and 70TCF. Figure 10 and Table III shows the behavior of natural gas production of Bangladesh under these conditions. The result shows that when the ultimate reserves vary from lower to higher amount, with the same intrinsic growth rate, the production peak will occur in longer time with higher production amount. In the Figure 7, the dotted lines as 1, 2 and 3 are indicating UR 50TCF, 60TCF and 70TCF million tons respectively.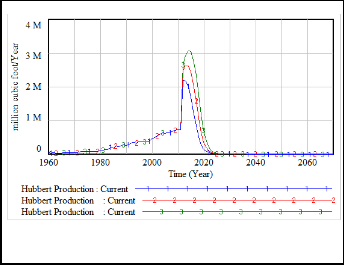
Fig.11. Hubbert Production at Different Intrinsic Growth
Rates. TABLE IV
ILLUSTRATION OF HUBBERT PEAK UNDER DIFFERENT INTRINSIC GROWTH RATES.
Scenario | Hubbert Peak Time | Hubbert Production (Million Cubit Foot/Year) |
a=0.256 | 2012 | 2184550 |
a=0.356 | 2012 | 3037890 |
a=0.456 | 2012 | 3891230 |
Fig.10. Hubbert Production at Different UR.
TABLE III
ILLUSTRATION OF HUBBERT PEAK UNDER DIFFERENT ULTIMATE RESERVES.
Scenario | Hubbert Peak Time | Hubbert Production (Million Cubit Foot/Year) |
UR=50TCF | 2012 | 2184550 |
UR=60TCF | 2014 | 2615880 |
UR=70TCF | 2014 | 3060240 |
The Hubbertʹs equation is highly dependent on the intrinsic growth rate. Here, this parameter is changed to perform a sensitivity analysis. Figure 11 and Table IV show the results of this sensitivity analysis. Three different models have been implemented with different intrinsic growth rate. The three values are 0.256, 0.356 and 0.456. The results show that when the intrinsic growth rate varies from lower to higher amount, with the same ultimate reserves, the production peak will occur in lower time with higher production amount. In the Figure 11 the dotted lines as 1, 2 and 3 are indicating intrinsic growth rates of 0.256, 0.356 and 0.456 respectively and table IV represents the corresponding values.
After careful analysis the above table gives very important result. With just an overview from the results it is seen that in all the cases the peak time is not changing whereas the peak time is occurring with a high production value. It is more alarming as it indicates that now the natural gas will last for even less period.
The gas peak worldwide has alarmed its ring long back. The scenario is no different here in Bangladesh. The unquenchable thirst for the natural has come in existence. The connection of a natural gas in household for cooking utilities are far in reach which aware and help explain the severity of gas crisis era of the country. According to this simulation the gas is going to hit the peak the year
2012.Thus the paper implies that it’s high time that an effort
must be put on in the ongoing a crisis of the natural gas of Bangladesh. The rise of such alarming era poses bundle of questions on the future growth of economy and the near future of the country since natural is as far discussed so far is well understood that it is considered as the backbone of the economy and its growth of the country. The country with its economy is being dragged to a complete oblivion where things are blurred with a clear view of the country’s stand in the next decade. The paper discusses in detail how the economy of the country rests heavily on the natural gas
IJSER © 2012 http://www.ijser.org
International Journal of Scientific & Engineering Research, Volume 3, Issue 10, October‐2012 8
ISSN 2229‐5518
consumption with a Hubbert peak model of this resource
with details of sector wise use of the gas.
[1] Bureau of South and Central Asian Affairs (March
2008). Accessed June 11, 2008. This article incorporates text from this source, which is in the public domain.
[2] ʺFull blown RMG violence at Ashuliaʺ The Financial
Express VOL 18 NO 168 REGD NO DA 1589 Dhaka, Tuesday June 22, 2010. Retrieved July 17, 2010.
[3] Hubbert, M.K., 1956. Nuclear energy and the fossil
fuels. Drilling and Production Practice, 1st Ed.The
American Petroleum Institute, New York, pp: 7 – 25. [4] Energy Bangla, Government of the People’s Republic
of Bangladesh. http://www.energybangla.com/index.php?mod=artic le&cat=GasSector&article=2354
[5] Asia Trade Hub. Information available at http://www.asiatradehub.com/bangladesh/oil2.asp
[6] Energy Bangla, Government of the People’s Republic of Bangladesh. Information available at http://www.energybangla.com/index.php?mod=artic le&cat=GasSector&article=24945
[7] The Daily Star Newspaper of Bangladesh.
http://www.thedailystar.net/newDesign/news‐
details.php?nid=132766
[8] Protham Alo Newspaper of Bangladesh. http://eprothomalo.com/index.php?opt=view&page=
1&date=2012‐01‐19
[9] Energy Bangla, Government of the People’s Republic of Bangladesh. Information available at, http://www.energybangla.com/index.php?mod=artic le&cat=GasSector&article=15185
[10] Energy and Mineral Resources Division, Government
of the People’s Republic of Bangladesh. http://www.emrd.gov.bd/43221.html
[11] Natural Gas Options for Bangladesh, Winter 2000,
Mark Jaccard, Mujibur Rahman Khan, John Richards.
APPENDICES
IJSER © 2012 http://www.ijser.org