International Journal of Scientific & Engineering Research, Volume 3, Issue 5, May-2012 1
ISSN 2229-5518
A Smart device to identify Leakages in water pipeline
Authors: Abbas Badami, Anmol Shahani, Fenil Shah.
Abstract: Have you ever come across a water pipeline continuously oozing water out of it, which flows down the roads and into the gutters? I am sure you would have. This is a common scene especially in India, where the total length of water pipelines spread across the country goes in to lakhs of kilometers. Fresh water, as fossil fuels, is scarce and must be utilized efficiently. Many methods for controlling leakage from urban water supply systems have emerged, but it still remains a challenge in developing countries like India. This paper describes a smart device which ‘scans’ the entire water pipeline and give the exact location of leakage area in the pipeline. Also one of the major important uses of this device is that it can identify illegal connections in the water pipeli ne by providing their exact location.
Keywords: Leakage detection, water theft detection, LED, Photodiode.
—————————— ——————————
Introduction:
A water system includes intakes, water pipelines, storage reservoirs and pumps. Once the water enters the system at the intakes from the source, pumps provide energy to convey the water through the pipelines to storage reservoirs from which it is distributed to consumers. Pipelines are formed of multiple pipes with joints and leakage generally occurs where the pipe joints are faulty or where defects develop in the pipe body. The longer leaks remain unattended the larger the economic and resource loss will be to the authorities, as electric power to run the pumps and chemicals to treat water are also wasted. Pressure in mains, water hammers, soil instability, corrosion of water pipes, poor quality of fittings, traffic loading, age of components are some of the main factors affecting leakage.
A survey carried out by World Health Organization found that the total water loss due to leakage in India is approximately 20-35% of the total flow in the system. At a conservative estimate, the national loss of processed water through leaks in the water distribution systems amounts to 10¹² liters per year¹, which is equivalent to
1000 million rupees.
Current Techniques:
Following are some of the few techniques used currently for the detection of leakages in the water pipelines across the country:
1) Walking: Walking over the main looking for telltale signs of presence of water.
2) Sounding: Water escaping from a pressurized pipe emits a sound similar to the sound that can be heard when a sea shell is held up to the ear. The range of frequency of the sound depends upon many factors such as nature of leak, size of hole through which water is escaping, the pipe material, nature of ground in which pipe is laid etc.
3) By installing bulk and small size flow meters in the entire pipeline.
But, these techniques are not up to date and hence not accurate. There are a lot of errors in the final assessment and the readings are not accurate. The reasons behind them are as follows:
1) Walking the entire stretch of pipeline involves a lot of manual work and is not possible to check every hole manually. Also, a considerable amount of pipelines are underground, hence there is a limit to this technique.
2) Even sounding technique involves analyzing the entire stretch of pipeline manually which again puts a limitation to man power. Also some of the pipelines are deep underground and buildings constructed above them. These portions of the pipeline cannot be analyzed. Along with this, noise from nearby factories and vehicles may also combine with sound of water from the ground and indicate false readings.
3) Meter sizes must be sized according to current supply hours. Future changes to system operation may require the substitution of some bulk meters with those of a smaller size, due to reductions in flow over longer supply hours. It is expected that bulk meters installed in locations where supply is rationed will tend to over-read. This is because when supplies are turned on, the air present in the pipes can cause the meter to spin. This again introduces errors in the final readings.
All these techniques give us a rough idea of the leakage and the location of it along the pipeline. This paper is expected to solve this problem and can give accurate information about the size of dent as well as accurate location which would help in repairing the pipeline in much lesser time. Above this, the device can also find any illegal
IJSER © 2012 http://www.ijser.org
International Journal of Scientific & Engineering Research, Volume 3, Issue 5, May-2012 2
ISSN 2229-5518
connections taken along the pipeline along with its location by mere observing the graph in the computer.
Construction:
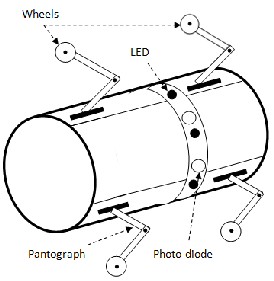
Figure 1 (a) shows the construction of the device. The device is made up of hollow metal tube about 1 foot in length. The diameter of the hollow metal tube is 15 centimeters approximately. Four wheels are connected to the metal tube such that two wheels are in top side and two in bottom. The two wheels in top and bottom are connected diagonally opposite to each other as shown in figure 1 (b). Each wheel is connected using a pantograph. These pantographs will allow the device to be used in pipelines of different diameters.
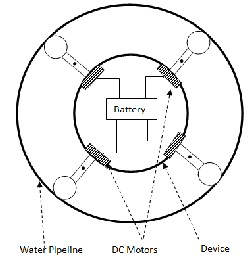
Figure 1 (a) : Constructional Diagram
Figure 1 (b) : Constructional Details
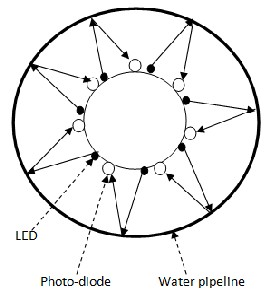
Figure 2 : Principle of working
The total diameter of the device with wheels attached should be exactly equal to the diameter of the water pipeline so that the device fits exactly in the water pipeline. The angle of pantograph is adjusted so that the all the four wheels touch the pipeline boundary. The wheels are connected to four DC motors which are then connected to a DC battery that provides current to all DC motors. The RPM (Revolutions per Minute) of the DC motors is selected such that the speed of the device is maintained at 10 kilometers per hour.
As shown in figure 1 (a), a narrow strip of LEDs and photodiodes connected in alternate fashion is placed at the center of the hollow metal tube, in between the wheels.
Principle of working:
The aim of this paper is to find any dent in the water pipeline which leads to the leakage of water through the pipeline. In our model, we adopt a light-to-electricity sensing technique to detect leak in pipeline. To use light detection through a hole in a pipe to indicate the occurrence of a leak presents a challenge of how the circuit will measure light intensity. It is therefore imperative to choose an appropriate transducer which for our case is LEDs and photodiodes. As shown in figure 2, LEDs will emit light which will be reflected from the inner boundary of the water pipeline and incident on the photodiode. The photodiode will convert the incident light intensity into equivalent current which will then be converted to voltage using current to voltage converter using op-
IJSER © 2012 http://www.ijser.org
International Journal of Scientific & Engineering Research, Volume 3, Issue 5, May-2012 3
ISSN 2229-5518
amp. and store in the memory. This light detector is a current to voltage converter. The FET input op-amp prevents the loading of
the photodiode. The voltage at the output is proportional to the current in the photodiode. So long as the photodiode response to the light is linear, the output voltage is proportional to the light falling on the photodiode. As shown in figure 2, a convex lens should be placed above the LEDs so as to direct the rays of light at an angle α with the outer boundary of the metal tube. The angle α should be selected based on the distance of LEDs and photodiodes with the inner boundary of water pipeline. The output of the photodiodes will be uniform where the pipeline is solid and intact but wherever there is a dent, the light incident on the photodiode will change thereby changing the output of photodiode. The intensity can be plotted on the graph and the graph will show the dents in the water pipeline along with its position.

The output of photodiodes which will be in the form of current which will first be converted to voltage and is added by an analog adder. The sum signal will then be given to an A/D converter which converts the signal in digital format. The digital signal is then given to microcontroller that stores the desired signal by executing a program. A Real time clock (RTC) is connected to one of the ports of microcontroller as shown in Figure 3
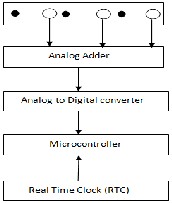
Figure 3 : Block Diagram
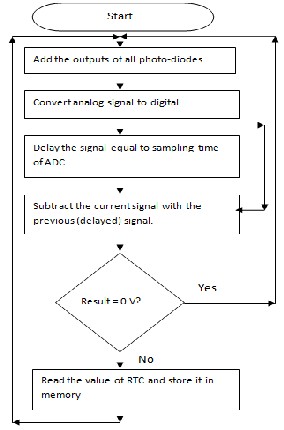
Figure 4 : Flow chart
As shown in the flow chart alongside, as soon as the device is put in the water pipeline and switched ON, photodiodes will output current which is proportional to light intensity falling on it. This current is converted into voltage and given to adder that adds signals from all the photodiodes. This signal is given to a 10-bit ADC that converts the signal in digital format for further processing. The digital signal is delayed by a time interval which is equal to the sampling rate of ADC. Then the delayed signal and the current signal are subtracted. If the subtraction is 0, it means that there is no dent between two adjacent scans whose distance is very small. But, if the result of subtraction is not 0, it means that there is a change in light intensity in the adjacent scans and that there is a dent at that place. At this instance, the microcontroller will read the value of real time clock which will start running as soon as the device is put ON and store it in its internal memory. The values of RTC will be fed to the computer which will show the exact location of dent in the pipeline. This is done in order to reduce redundancy in the system and saving unnecessary use of memory. The microcontroller will keep on checking the subtraction till a non zero value is obtained. Practically, a threshold value has to be set and the microcontroller has to be programmed to consider a dent if
IJSER © 2012 http://www.ijser.org
International Journal of Scientific & Engineering Research, Volume 3, Issue 5, May-2012 4
ISSN 2229-5518
the result of subtraction exceeds a pre-defined threshold. This is done because the inner surface of water pipeline is newer uniform and plain. It has corrugated surface. Hence, there will be a small difference in values of two scans even though there is no dent present.
After the complete scan of water pipeline, the information is stored in the memory. This memory is interfaced with the computer. The computer runs software with the data from memory as input and displays the data in form of a graph on the monitor.
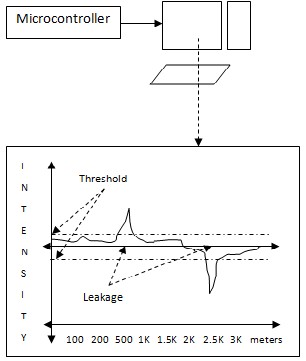
By the formula: speed=distance/time, the software can be easily calibrated to display the graph of distance vs. intensity since speed and time are known to us. The variations in the graph indicate either dents in the pipeline or it indicates illegally taken take-off from the water pipeline. Figure 4 shows a prototype of memory interface with the computer and the graph as seen on the monitor. The graph will show small fluctuations at joints in the water pipeline. Hence, based on the values of the intensity at the joints, a threshold value is selected and the signals above this threshold are considered as dents in the water pipeline.
Figure 5 : Output
In an event if the device gets stuck in the pipeline due to any miscellaneous reason, there is a radio beacon connected at front and end of the device which is programmed to transmit a predefined signal if all the four wheels stop rotating for more than 2 seconds.
Advantages:
1) It’s a smart and fully automatic device.
2) The amount of time required to know the dents in the entire water pipeline is the amount of time required for the device to scan the pipeline at speed of 10 kilometers per hour. The speed can further be increased if required.
3) The device is simple in construction and hence has low cost.
4) The device is very compact and require small entry and exit points.
5) The pantograph allows the device to be used in pipelines with different sizes as it will adjust according to the diameter of water pipeline.
Applications:
1) The device can be used to find leakages in water pipelines as mentioned.
2) It can also be used to find leakages in natural gas pipelines, liquid hydro-carbons pipelines, pipelines containing petroleum products etc. that runs throughout the country as well as across the continents.
3) Only two access points are needed into the pipe -- one at insertion and one at extraction.
4) Corrosion detection can also be done with slight modifications of this device.
Conclusion:
This smart device will revolutionize the entire field of leakage management and help in repairing the leakages and finding out the illegal connections easily, thereby saving millions of liters of water along with time and energy.
References:
[1] Bulletin of the World Health Organization, 61 (5):
867-870 (1983).
[2] http://www.puretechltd.com/products/smartball/s martball_leak_detection.shtml
[3] Leak Detection in pipelines by John A. Luopa,
P.Eng., Colt Technologies, 120, 5008 - 86 Street, Edmonton, Alberta T6E 5S2.
[4] Inspection of micro-cracks on solderball surface using a laser scattering method by C. Quan a,), S.H. Wang a, C.J. Tay a, H.M. Shang a, K.C. Chan b, a Department of Mechanical and Production Engineering, National UniÍersity of Singapore, 10
Kent Ridge Crescent,Singapore 119260,
IJSER © 2012 http://www.ijser.org
International Journal of Scientific & Engineering Research, Volume 3, Issue 5, May-2012 5
ISSN 2229-5518
[5] A model for real time leakage detection in pipelines: A case of an integrated GPS receiver by V. O. S. Olunloyo1 and A. M. Ajofoyinbo2 Department of Systems Engineering, Faculty of Engineering Complex University of Lagos, Akoka Yaba, Lagos,Nigeria.
[6] DEVELOPMENT OF THE DETECTION SYSTEM OF METHANE LEAKAGEUSING 3.2μm MID- INFRARED LED AND PD by
Gyou-tae Park 1, Kyu-cheol Park 3, Geun- jun
Lyu 1 , Jeong-rock Kwon 1,
Young-gyu Kim 1, Byoung-jo Ryou 2, Jung- il Park
4
1. Institute of Gas Safety R&D, Korea Gas Safety
Corporation, 2. Korea Gas Safety Corporation
3. School of Electrical & Electronic Engineering, Yonsei University,
4. School of Electronic Engineering, Yeungnam
University.
[7] Smart Sensing, Monitoring, and Damage Detection for Civil Infrastructures by
Chung-Bang Yun. and Jiyoung Min.
IJSER © 2012 http://www.ijser.org