but carefully collected from pebbly units. The size of the peb- bles collected vary from - 2ɸ to -5ɸ. Pebbles collected include only pebbles with isotropic constitution, high resistivity to wear and high abundance. Broken and feldspathic pebbles
International Journal of Scientific & Engineering Research, Volume 4, Issue 12, December-2013
ISSN 2229-5518
2185
Odumodu, Chukwuemeka Frank and Ugwuona, Emmanuel Nwachukwu
Abstract --- Pebble morphometric, sand textural studies as well as lithofacies study and paleocurrent analysis were carried out so as to decipher the paleodepositional environment of the Ajali Formation, in the Anambra Basin. The lithofacies study suggests that the Ajali Formation consists of six sedi- mentary facies; coarse grained cross-bedded sandstone – sandflat, ripple laminated fine grained sandstone - tidal channel, ripple laminated heteroliths – mixed flat, ripple laminated mudstones – mudflat, interlaminated clay and thin pebbly sandstone – point bar and claystone facies – floodplain. Results of form indices calculated for pebbles indicate that the mean coefficient of flatness ranges from 32.74 to 49.53, the mean sphericity ranges from 0.532 to
0.723, the mean oblate – prolate index range from 0.159 to 4.505, while the mean roundness index varies from 0.311 to 0.498. These results suggest that means of coefficient of flatness and sphericity lies within and above the limits for fluvial pebbles, thus suggesting both fluvial and (beach) shallow marine influence. Bivariate plots of coefficient of flatness against sphericity and sphericity against oblate – prolate index suggest that the formation was
deposited by both fluvial and (beach) shallow marine processes. Plots made on the sphericity form diagram do not show any significant trend between sphericity and pebble sizes. Bivariate plots of mean diameter against standard deviation and skewness against standard deviation favours a fluvial origin for the sandstones. Most sedimentary structures such as herringbone cross bedding, reactivation surfaces and bimodal paleocurrent pattern are sugges- tive of tidal origin. The sedimentary facies is suggestive of deposition in both fluvial and tidal settings. This study has shown that the Ajali Formation is a product of fluvial transport and tidal sedimentation in a shallow marine environment.
Keywords: Anambra Basin, Ajali Formation, Coefficient of flatness, Oblate-prolate index, Sphericity, Roundness, fluvial origin
.
Pcontroversial. The AjIali ForJmation has Sbeen severally
ENigeria, betweenRlongitudes 6°30′E and 8°00′E and latitudes
—————————— ——————————
revious interpretations on the paleo-depositional envi- ronment of the Ajali Formation have remained largely
The study area lies within the Anambra Basin in southeastern
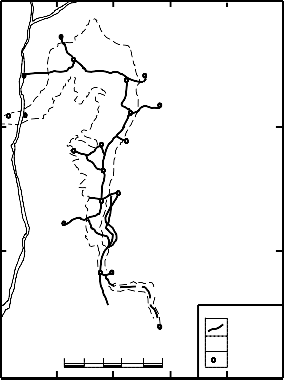
interpreted as formed in a fluvial / fluviodeltaic environ- ment [28], [14] and / or a tidally influenced environmental set- ting [4], [2], [18]. These interpretations were based mainly on facies, sedimentary structures, trace fossils, petrography and paleocurrent patterns. Previous studies using pebble form indi- ces for paleoenvironmental interpretations for the Ajali For- mation [3], [25] supports the fluvial origin for the formation. These studies may however be biased, since they considered pebbles from only one or very few outcrops. The present study therefore reports and evaluates the results of measurements carried out on pebbles from five different outcrops of the Ajali Formation from several parts of the Anambra Basin (Fig. 1). The results of these studies are also corroborated with other evidence such as sand textural parameters, sedimentary struc- tures / sedimentary facies and paleocurrent studies from sev- eral outcrops of the formation in the Anambra Basin.
————————————————
• Ugwuona, Emmanuel Nwachukwu is currently pursuing doctoral degree in
Petrology at the University of Nigeria, Nsukka, Nigeria. He is a Lecturer in Anambra State University, Uli, Anambra State, Nigeria. Email: kin- somino@yahoo.com
5°20′N and 7°50′N (Fig.1). The stratigraphic sequence in the Anambra Basin is well discussed in several literatures [28], [1], [26]. The oldest sedimentary formation in the Anambra Basin is the Nkporo Group (Nkporo Shale, Enugu Shale, the Afikpo Sandstone and the Owelli Sandstone). The Nkporo Group is Campanian to Lower Maastrichtian in age. It consists of dark gray shales and mudstones and occasionally thin beds of sandy shale, sandstone, shelly limestone and coal. The Nkporo Group is conformably overlain by the Mamu Formation. The Mamu Formation consists of an assemblage of sand- stones, shales, mudstones and sandy shales, carbonaceous shales and coal seams. The Mamu Formation is conformably overlain by the Mid-Maastrichtian Ajali Formation. The Ajali Formation consists of thick, friable, poorly sorted, medium to coarse-grained sandstones, typically white in colour, with dis- tinct mud drapes and burrows. It is one of the most extensive stratigraphic units in this basin. The Ajali Formation is con- formably overlain by the Late Maastrichtian to Danian Nsukka Formation.
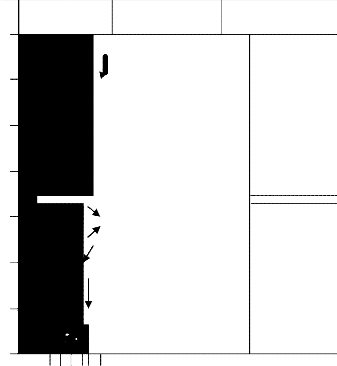
Ten lithologic sections were systematically logged at the follow- ing locations; Ugwuaba-Asaga Ohafia, Isiukwuato, Uturu, Ihu- be, Okigwe and Arochukwu all in Abia State, Mbiabong in Cross-River State, Abor near Ngwo, in Enugu State, Idah in Kogi State and Fugar in Edo State of Nigeria (Fig. 2). The log- ging also involved the collection of sedimentological, ichnologi- cal and paleocurrent data. Quartzose pebbles were randomly
IJSER © 2013 http://www.ijser.org
International Journal of Scientific & Engineering Research, Volume 4, Issue 12, December-2013
ISSN 2229-5518
2186
but carefully collected from pebbly units. The size of the peb- bles collected vary from - 2ɸ to -5ɸ. Pebbles collected include only pebbles with isotropic constitution, high resistivity to wear and high abundance. Broken and feldspathic pebbles
LITHOLOGY DESCRIPTION
12
INTERPRETATION
14
LITHOLOGY DESCRIPTION INTERPRETATION
Coarse grained sandstone
with three sets of Planar cross beds
8 Ripple laminated fine sand- stone / clay heterolith. Flaser
12
flat
10
Mixed flat
Large scale planar crossbeds, including
Ophiomorpha & Skoli- thos burrows
flat
Poorly sorted planar cross
Ophiomorpha burrows
8
Low Sand
Floodplain
grained sandstone with mud drapes.
Mixed flat
Contains Rhizocorallium, Thalassi-
noides & Planolites ispp 4
Medium grained sandstone withOphiomorpha,herringbone deformed crossbedding, convo- lute structures & reactivation surfaces with mud drapes
Lower Sand flat
0 Coarse grained, pebbly sand- stone with Ophiomorpha
Sh Si Fs MsCs Ps
A :Loc 1: Onyekaba Quarry, near Okigwe
0
Sh Si FsMsCs Ps
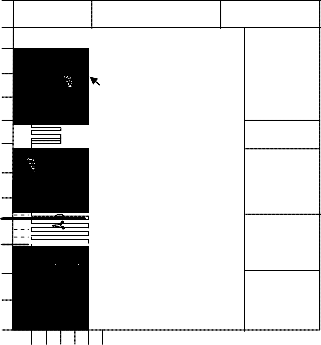
LITHOLOGY
16

DESCRIPTION INTERPRETATION
LITHOLOGY DESCRIPTION INTERPRETATION
12
Medium to
Coarse grained,
pebbly sandstone
8
4
Sand Flat 8
Fine grained sand- stone
Clay
Fine to medium grained
Sandstone
Coarse grained pebbly
Sandstone
Coarse grained
Sand Flat
Floodplain
0
Sh Si Fs Ms Cs Ps
Med. To coarse grained
0 cross bedded sandstone
ShSiFsMsCsPs
![]()
INTERPRETATION
![]()
![]()
12
IJSER © 2013 http://www.ijser.org
Poorly sorted medium grained sandstone
![]()
![]()
![]()
Low
International Journal of Scientific & Engineering Research, Volume 4, Issue 12, December-2013
ISSN 2229-5518
2187
IJSER

INTERPRETATION
182
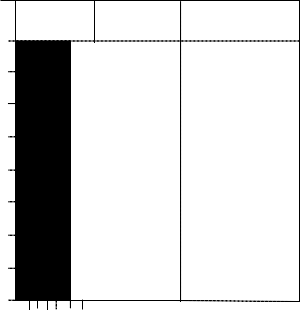
LITHOLOGY
DESCRIPTION INTERPRETATION
IJSER © 2013 http://www.ijser.org
Wave ripple laminated heterolith of siltstone
![]()
Nsukka Fm ?
4 and clay 32
International Journal of Scientific & Engineering Research, Volume 4, Issue 12, December-2013
ISSN 2229-5518
2188
IJSER
were carefully avoided. The pebbles were washed and labeled appropriately. The long (L), intermediate (I) and short (S) axes of each of the five sets of pebbles collected were measured using the vernier caliper, following the procedures described by [31], [6]. The pebbles were grouped into half phi size classes according to their intermediate axes, which are also referred to as “sieve diameter” (Table 1).Roundness of pebbles was de- termined through visual comparison with [29] image chart. This
IJSER © 2013 http://www.ijser.org
International Journal of Scientific & Engineering Research, Volume 4, Issue 12, December-2013
ISSN 2229-5518
2189
method was also utilized by [31], [22], [24], [25]. About 15 sandstone samples were also collected and studied using the conventional sieving method of [9]. The samples were dis- aggregated carefully and 50 gram of each sample was sieved using half phi intervals and a 15 minutes sieving time. Critical percentiles (5ɸ, 16ɸ, 25ɸ, 50ɸ, 75ɸ, 80ɸ and 95ɸ) were com- puted from plotted frequency and smoothed frequency curves.
standard deviation of a population. Textural parameters of sandstones such as graphic mean (Mz), inclusive graphic
skewness (Ski ), inclusive graphic standard deviation or sortng
(σo ) and Kurtosis (KG) were computed using appropriate for-
mulae (Table 3) [20], [9].
Table 1: Grain size scales for pebbles [34]
8°00'N
7°00'E 8°00'E
Dekina
Ayangba
9°00'E
8°00’N
![]()

mm Phi Class Term
48 - 64 > - 5.5
32 – 48 > - 5.0
24 – 32 > - 4.5
Fu-
Itobe
OchXodamu
Ankpa
Okaba
Odoba
16 – 24 > - 4.0 Pebble
12 – 16 > - 3.5
7°00’N
Idah Okpo
Obolo
7°00'N
8 – 12 > - 3.0
6 – 8 > - 2.5
NsukAkaforObolo
X
4 - 6 > - 2.0
Granule
Nkpologu
O Etiti
Abor
Table 1: Pebble morphometric Indices used for the study
6°00'N
Awka
X
Udi
Enugu
6°00'N
XUturu
Okigwe Isiukwuato
X
5°00'N
![]()
Scale
OhafiaX
Mbiabong
ArochuXkwXu
0 20 40 60 Km
7°00'E 8°00'E
LEGEND ![]()
![]()
Roads
Outcrops
Towns ![]()
9°00'E
FIG. 1. – Outline Map of the Ajali Formation showing the loca- tions of the outcrops studied
The values of the long, intermediate and short axes measured,
were loaded into an excel spreadsheet. The following form indices were calculated by using the following formulas (Table
2) Means and standard deviations of morphometric indices were calculated for each set of pebbles, using known statistical
formula as given below![]()
Table 2: Textural parameters
Mean =![]()
![]()
x = ∑ x − − − − − − − − − (6)
![]()
n
(∑=x)2
∑ x 2 −
SD =σ (n − 1) = n − − − (7)
n − 1
4 RESULTS
The computed form data and roundness data are given in Ta-
ble 4 and 5 respectively. Pebble morphometric results (Table
4a) shows that the mean values of maximum projection sphe-
ricity range from 0.532 to 0.723 and mean values of oblate –
Where x = the deviations of each of the numbers xj from the prolate index range from 0.159 to 4.505. The mean values of
mean, n = the number of samples in a population, σ = the the coefficient of flatness range from 32.74 to 50.82. The form
IJSER © 2013 http://www.ijser.org
International Journal of Scientific & Engineering Research, Volume 4, Issue 12, December-2013
ISSN 2229-5518
2190
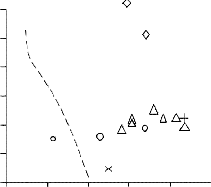
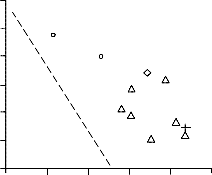
indices are represented graphically by plots of coefficient of flatness against sphericity (Fig. 3) [32], and plots of sphericity versus oblate – prolate index (Fig. 4) [6].
Sieve analysis results for sandstones from Ajali Formation us-
ing graphic method are given in Table 6. Certain parameters such as graphic mean, inclusive graphic skewness, inclusive
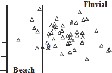
standard deviation, and kurtosis were calculated so as to use the standard plots of [11], [12], [13] and [21] to infer the paleo- depositional environments of the Ajali Formation. Plots of skewness against standard deviation (Fig. 5a) and mean di- ameter against inclusive graphic standard deviation (Fig. 5b) favours a fluvial origin for the sandstones![]()
Table 4 : Pebble Form Indices for the Ajali Formation pebbles
Coefficient of flatness | Sphericity | Oblate -Prolate Index | |||||
n | × | s | × | s | × | s |
![]()
(A) Combined form Data for pebbles larger than – 2.0 phi
Locality
1. Ohafia 50 50.82 7.38 0.723 0.055 2.818 3.775
2. Mbiabong 50 32.74 14.31 0.532 0.131 0.159 7.506
3. Arochukwu 40 49.53 11.56 0.694 0.095 1.295 3.737
4 Isiukwuato 50 41.33 11.45 0.646 0.093 4.505 5.825
5 Enugu 50 47.08 9.38 0.702 0.082 0.885 0.929
(B) Form Data for Location 1 (Ohafia)
Phi Class
> - 2.5 7 45.77 3.52 0.721 0.036 6.836 2.680
> - 3.0 38 51.61 7.60 0.723 0.056 2.174 3.642
> - 3.5 5 51.83 0.08 0.723 0.079 2.088 0.286
(C) Form Data for Location 2 (Mbiabong)
> - 2.0 7 27.27 13.30 0.504 0.150 9.367 9.308
> - 2.5 24 36.07 17.06 0.567 0.138 0.961 4.725
> - 3.0 19 30.57 9.85 0.497 0.107 - 4.603 6.213
(D) Form Data for Location 3 (Isiukwuato)
> - 2.0 4 44.34 14.21 0.717 0.118 9.488 3.635
> - 2.5 22 37.11 9.43 0.624 0.089 6.705 6.262
> - 3.0 21 45.43 12.43 0.665 0.092 2.103 3.714
> - 3.5 3 39.49 6.06 0.598 0.033 - 1.461 6.710
(E) Form Data for Location 4 (Enugu)
> - 2.5 | 12 | 46.31 | 8.61 | 0.725 | 0.072 | 1.548 | 0.620 | |
> - 3.0 | 36 | 47.55 | 0.10 | 0.694 | 0.086 | 0.645 | 0.926 | |
> - 3.5 | 2 | 2 | 43.35 | 3.59 | 0.689 | 0.043 | 0.386 | 0.386 |
(F) Form Data for Location 5 (Arochukwu) | ||||||||
> - 3.5 | 9 | 9 | 52.47 | 11.72 | 0.727 | 0.077 | 2.353 | 3.165 |
> - 4.0 | 20 | 2 | 49.04 | 11.45 | 0.691 | 0.092 | 1.528 | 3.088 |
> - 4.5 | 6 | 50.36 | 9.23 | 0.705 | 0.074 | 1.074 | 5.632 | |
> - 5.0 | 5 | 45.20 | 15.95 | 0.633 | 0.146 | - 1.274 | 4.483 |
![]()
IJSER © 2013 http://www.ijser.org
International Journal of Scientific & Engineering Research, Volume 4, Issue 12, December-2013
ISSN 2229-5518
2191
![]()
Table 5 : Roundness indices for the pebbles from the Ajali Formation
A) Combined roundness indices for pebbles of sizes for the five locations studied
![]()
Roundness
![]()
Location n × s
1 Ohafia 50 0.311 0.127
2 Mbiabong 50 0.317 0.121
3 Arochukwu 40 0.484 0.126
4 Isiukwuato 50 0.459 0.202
![]()
5 Abor 50 0.498 0.118
B) Roundness indices for different fractions at the five locations studied
1 2 3 4 5
![]()
n × s n × s n × s n × s n × s
![]()
> - 2.0 7 0.294 0.087 4 0.573 0.132
> - 2.5 7 0.244 0.072 24 0.321 0.142 22 0.461 0.221 12 0.503 0.138
> - 3.0 38 0.327 0.130 19 0.319 0.108 21 0.454 0.179 36 0.503 0.111
> - 3.5 5 0.286 0.286 9 0.467 0.167 3 0.300 0.312 2 0.385 0.148
> - 4.0 20 0.491 0.113
> - 4.5 6 0.517 0.090
![]()
> - 5.0 5 0.450 0.154
C) Combined roundness indices of all pebbles for the different size fractions
Roundness
n × s
![]()
> - 2.0 11 0.395 0.103
> - 2.5 65 0.393 0.160
> - 3.0 114 0.405 0.120
> - 3.5 19 0.396 0.182
> - 4.0 20 0.491 0.113
> - 4.5 6 0.517 0.113
> - 5.0 5 0.450 0.154
× is the mean roundness; s is the standard deviation of the observations
IJSER © 2013 http://www.ijser.org
International Journal of Scientific & Engineering Research, Volume 4, Issue 12, December-2013
ISSN 2229-5518
2192
![]()
B LOC.2: c
A LOC.1:OHAFL4. 100
100

80
MBIABONG
80
00 60
00
80
60
I> I'll
Fluvial
"'
60
40 "'
40
j'"'
40
Beach "i
"f'&rtA4""'o,"
"'A > "' 20
/!>
i-t; 20 20 0
i-t; 0.4 0.5 0.6 0.7 0.8 0.9 0.4 0.5 0.6 0.7 0.8 0.9 0.2 0.4 0.6 0.8 1.0
0
80 LOC. 4:
u.....
i-t;
E LOC. 5: F i\fEANS
100
50
i-t; 60 8
0
u 40 6
"' "
40
"'" 41>
20 " 40 3
0 20 20
0.2
1.0 0.4 0.5 0.6 0.7 0.8 0.9 0.2 0.3 0.4 0.5 0.6 0.7 0.8
SPHERICITY
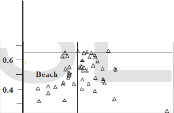
FIG.3 . - Graphical plots of coefficients of flatness and sphericity for individual pebbles at the five loactions studied (A to E)
and the means of these (F).Broken lines on these diagrams indicate the empirical lower limits of 0.65 for sphericity and 45 for coefficients of flatness of fluvial pebbles, determioed by Stratten,1974.
A
![]()
0.9 -
0.7
LOC I· OHAFIA
B 1.0
![]()
Flu'\riaJ -
LOC.2:i\lBL>\BOi\'G c 1.0
0.6

LOC.3:AROCHUKWU
Fluvial
• 'A
,
0.5 Beach
0.8
8 ,o, Flu'\rial
0.8
0.4
0.2
Beach
",4":"#-""',.)"'
..... 0.3 +---. ----...1--...-.-.,....-1-....,._1
0.2 -t----.----'.,.---r---r----r
o------,- -- , ;-----; ;-----
u -10 -5 0 5 10 15
1:2
-20 -10
0 10
20 30
10 5 0 5 10
MEANS
D
1.0
LOC. 4:ISIUKWUATO
E
0.8
![]()
LOC. 5:ABOR- NGWO F 0.8
-
![]()
Fluvial
""' "'
0.8
0.6
0.4
0.6
0.4
0.2
Beach
0.6 -
0.4-
-
0.2 -
-
-------- --------------
Beach
0.2 +--...J.-.-..,..--.--...,....
04--,_±--,&---,i--
o---- ----._..,.....1 ,_1----
- 10 -5
5 10 15 20
OBLATE - PROLATEINDEX
- 10 - s 0 s 10
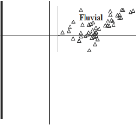
FIG. 4- Graphical plots or sphericity and oblate - prolate Index ror IndiVIdual pebbles at lbe nve locations studied (A £O E ) and the means of these (F).Broken lines on these diagrams indicate the empirical lower limits of -1.5 for oblate - prolate index and 0.65 for sphericity for fluvail pebbles, determined by Stratten (1974).
IJSER©2013 http:/An.rvvw.ijser.org
International Journal of Scientific & Engineering Research, Volume 4, Issue 12, December-2013
ISSN 2229-5518
2193
![]() Onyekaba Quarry
Onyekaba Quarry
![]() Ohafia
Ohafia
![]() Mbiabong
Mbiabong
![]()
Arochukwu
4
(a)
3
2
1
0
-1
-2
Beach
River
Abor
(b)
3.0
2.0
1.0
0
Beach
River
0.2 0.4 0.6 0.8 1.0 1.2
Standard Deviation
0.2 0.4 0.6 0.8 1.0 1.2
Standard Deviation
Fig. 5 (a): Bivariate plot of mean size against standard Deviation (After, Miola and Weiser, 1968) and (b): Bivariate plot of skewness against standard deviation (After Friedman, 1967 & Miola and Weiser, 1968)
Table 6: Sieve Analysis Result (Graphic method) for the Ajali Formation
Mean size
Standard
Deviation
Skewness Kurtosis INTERPRETATION
/ REMARKS
Onyekaba Quarry 0.73 1.07 0.25 1.02 c,ps,fs,M Mbiabong 0.29 0.70 - 1.50 0.86 c,mws,vns,P
Abor | 1.70 | 0.88 | 3.10 | 0.77 | m,ms,vps,P |
Arochukwu 1 | 2.00 | 0.60 | - 0.38 | 1.0 | m,ms,vns,M |
Arochukwu 2 | 2.38 | 0.43 | - 0.43 | 1.18 | f,ws,vns,L |
Arochukwu 3 | 1.76 | 0.88 | - 0.10 | 0.77 | vc,ms,ns,P |
Ohafia 1A2 | 1.06 | 0.77 | -0.13 | 0.92 | m,ms,ns,M |
Ohafia 1A3 | 0.83 | 1.03 | 0.30 | 0.87 | c,ps,ps,M |
Ohafia 1A4 | 1.58 | 0.97 | 0.24 | 1.14 | m,ms,ps,L |
Ohafia 1A6 | 1.43 | 0.81 | 0.15 | 0.94 | m,ms,ps,L |
Ohafia 2A6 | 0.52 | 0.91 | 0.49 | 1.67 | c,ps,ns,M |
Ohafia 1A9 | 0.62 | 1.07 | 0.02 | 0.98 | c,ms,ns,P |

LEGEND
f = fine grained, m = medium grained, c = coarse grained, vc = very coarse grained, ms = moderately sorted, mws =
moderately well sorted, p = poorly sorted, fs = fine skewed, nS = nearly symmetrical,ns = negatively skewed vns =
very negatively skewed, ps = positively skewed, M = mesokurtic, L = leptokurtic, P = platykurtic.
8°00'N
7°00'E 8°00'E 9°00'E

N 8°00’N
Dekina
IJSER © 2013
http://www.ijser.org
International Journal of Scientific & Engineering Research, Volume 4, Issue 12, December-2013
ISSN 2229-5518
2194
IJSER
Fig. 6. – Regional paleocurrent pattern for the Ajali Formation
The regional paleocurrent direction of the Ajali Formation was reconstructed using cross-bed data (Table 7) collected from several locations across the Anambra Basin (Fig. 6). These
locations include (i) Ochodamu in Kogi State, (ii) Nkpologu in Enugu State, (iii) Umulolo junction, and (iv) Onyekaba quarry, in Okigwe, (v) Uturu, (vi) Isiukwuato, (vii) Ohafia, and (viii) Aro- chukwu, all in Abia State and (ix) Mbiabong in Cross-River
IJSER © 2013 http://www.ijser.org
International Journal of Scientific & Engineering Research, Volume 4, Issue 12, December-2013
ISSN 2229-5518
2195
State, (x) Idah in Kogi State and (xi) Fugar in Edo State of Ni- geria. Tilt correction was not done because the beds are nearly horizontal. The regional rose diagram shows a bimodal paleo- current pattern with the principal mode between 210° and 239° modal class. The vector mean azimuth calculated trigonometri- cally is 221° with a variance of 378° and standard deviation of
15°.
The sedimentary facies of the Ajali Formation were defined
using sedimentological and ichnological criterion. Six sedimen- tary facies were recognized and they include the following;
This facies is the most common sedimentary facies of the Ajali
Formation in the Anambra Basin. It consists of poorly sorted
medium to coarse grained sandstone with planar, trough, her- ringbone and convolute or deformed cross beddings. The trace fossils present here include Ophiormorpha and Skolithos bur- rows, belonging to the Skolithos ichnofacies. It is characterized by bimodal-bipolar paleocurrent pattern. This facies were ob- served at Onyekaba quarry, Asaga-Ohafia, Isiukwuato quarry, Abor, Uturu, Ihube, Mbiabong, and at Idah and Fugar. Interpretation
The coarse grained crossbedded sandstone facies is interpret- ed as a sandflat using [5] model. Sandflats occur within the
served include wave ripple lamination, flaser and lenticular laminations. Biogenic structures observed include Rhizocoral- lium, Thalassinoides, Planolites and Ophiomorpha burrows, all belonging to the Glossifungites ichnofacies. The thickness of bed varies between 1 and 3.5 metres.
The ripple laminated heterolithic facies is interpreted as a mixed flat environment following [5] model. The mixed flat envi- ronment is indicated by parallel laminated heteroliths of sand- stones and mudstones with an upward increasing mud content and occurrence of flaser bedding. The interbedded sandstone and mudstones represents roughly equal periods of suspen- sion and bedload deposition with bedload deposition increas- ing seaward [27].
The ripple laminated mudstone facies occurs at Uturu and Ihu-
be. The lithology consists of siltstone, silty clay and mud- stones. The thickness varies from 1cm to 40 cm. It is intensely bioturbated, containing Planolites and Thalassinoides burrows, belonging to the Cruziana ichnofacies.
The ripple laminated mudstones suggests deposition in a mud
flat environment. According to [5], the transition from mixed flats to mud flats is marked by flaser bedding passing landward into lenticular bedding.
IJSER
lower parts of most tidal flats and commonly contain dune
cross bedding in areas with high current speed and ripple
cross-lamination in areas where the current speed is lower [5]. Sandflats are commonly subject to subequal ebb and flow tidal current velocities, as indicated by common herringbone cross- bedding and reactivation surfaces. Soft sediment deformation structures such as convolute crossbeds are a common bed- ding feature in the intertidal parts of the sandflat.
The ripple laminated fine sandstone facies is not very common in the Ajali Formation. It consists mainly of wave ripple lami- nated fine grained sandstones. Sedimentary structure present is mainly wave ripple lamination. This facies were observed at Uturu quarry and its thickness is about 1.5 metres. Interpretation
The tidal channel is indicated by a scoured or erosional base with pebble lag overlain by a fining upward succession of sandstone beds which ranges from coarse to fine grained and is interpreted as a tidal channel incised into the intertidal flat environment. The sedimentary structures ranging from ripples in coarse-grained sand, to flat bedding in the succeeding fine- grained sandstone beds is indicative of lower to upper flow regime conditions; and this indicates increasing flow velocity within the tidal channel [34].
The ripple laminated heterolithic facies were observed at Uturu quarry, Ihube road-cut, and Onyekaba quarry, near Okigwe. It consists of ripple laminated heteroliths of clayey - mud with fine to coarse grained sandstones. The sedimentary structures ob-
It consists of a rhythmic succession of clay bands and some
thin basal lags. The clay bands are about 10 to 30 cm in thick- ness, while the basal lags are about 5 cm in thickness. The clay bands are purple to dark grey in colour. It also contains some conglomerates at the base. The clay bands are sparsely burrowed with some evidence of some unidentifiable burrows. This facies were observed at Uturu.
The interlaminated clay and thin pebbly sandstone facies is interpreted as a point bar environment. The point bar environ- ment is indicated by thin interlaminated clay-silt and sand- stones, sometimes occurring as tidal rhythmites which form lateral accretion bedding or inclined heterolithic stratification [27]. The point bar is also subdivided into discrete wedges by some inclined erosion surfaces.
This consists of massive sandy clays, with thickness from to cm. It is commonly lateritized and typically overlies the cross bedded sandstone facies.
The claystone facies is interpreted as a floodplain. The flood-
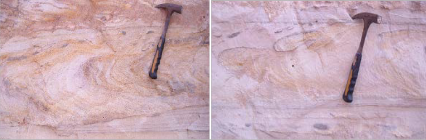
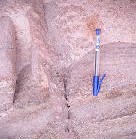
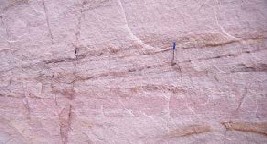
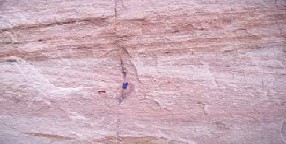
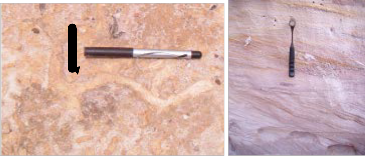
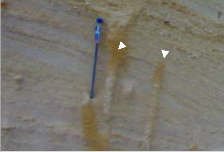
plain environment is indicated by the unfossiliferous clay and the presence of some leaf impressions. The various sedimen- tary structures observed in the Ajali Formation are shown in Fig. 7 and 8.
IJSER © 2013 http://www.ijser.org
International Journal of Scientific & Engineering Research, Volume 4, Issue 12, December-2013
ISSN 2229-5518
2196
Table 7a: Paleocurrent Analysis for the Ajali Formation | |||||
Location | Number of observations | Average foreset dip | Mean az- imuth | Variance | Standard Deviation |
Ohafia | 25 | 23 | 216 | 330 | 18 |
Onyekaba quarry | 30 | 25 | 212 | 145.7 | 12 |
Mbiabong quarry | 40 | 24 | 240 | 145.7 | 12 |
Uturu | 9 | 16 | 168 | 2964.5 | 54.4 |
Nkpologu | 6 | 26 | 254 | 7.2 | 2.6 |
Isiukwuato | 5 | 16 | 193 | 62.5 | 7.9 |
Ochodamu | 5 | 27 | 224 | - | - |
Fugar | 8 | 27 | 225 | 740 | 27 |
Regional mean | 128 | 24 | 221 | 378 | 15 |
IJSER
IJSER © 2013 http://www.ijser.org
International Journal of Scientific & Engineering Research, Volume 4, Issue 12, December-2013
ISSN 2229-5518
2197
a b c
d e
Ophiomorpha
Planolites beverlyensis
IJSThalassinoides ER
f g h
Rhizocorallium
Rhizocorallium j
i k
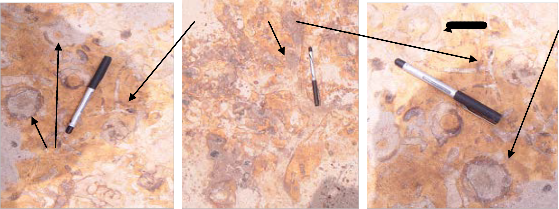
Fig. 7: Sedimentary structures and trace fossils from the Ajali Formation, (a & b) convolute crossbeds (c & f) Ophiomorpha nodusa burrows, (d & e) Herringbone crossbeds (g) Planolites burrows (h) Planar crossbeds (i, j & k) Thalassinoides and Rhizocorallium
burrows.
IJSER © 2013 http://www.ijser.org
International Journal of Scientific & Engineering Research, Volume 4, Issue 12, December-2013
ISSN 2229-5518
2198
IJSER
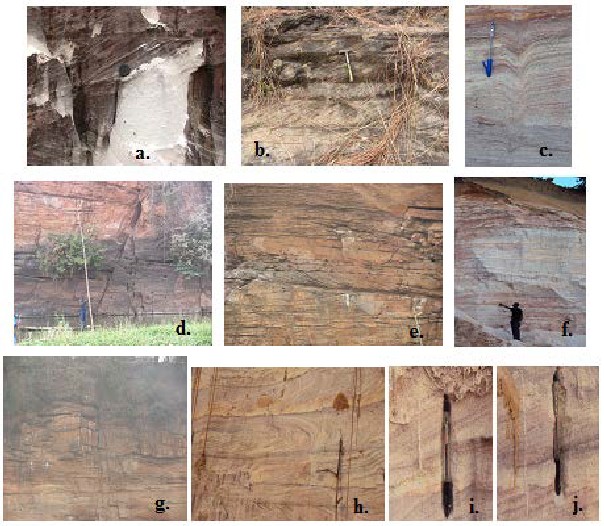
Fig. 8: Sedimentary structures and trace fossils of the Ajali Formation, a. Herringbone crossbeds (Fugar), b,e & f. Planar crossbeds (Fugar, Idah & Ohafia), c. deformed crossbeds (Ohafia), d. Idah, g. wave rippled sandstone beds (Idah), h. convolute crossbeds (Ohafia), I & j. Skolithos isp. (Ohafia).
IJSER © 2013 http://www.ijser.org
International Journal of Scientific & Engineering Research, Volume 4, Issue 12, December-2013
ISSN 2229-5518
2199
Pebble morphometric studies have been successfully used in paleoenvironmental interpretation [29], [8], [22]. Certain index limits have been established for pebble form indices. [32] es- tablished that fluvial pebbles have lower index limits of 45 and
0.65 for coefficient of flatness index and mean sphericity re- spectively, while [6] suggested a lower limit of 0.66 for the mean sphericity of river pebbles. Dobkins and Folk [6] indicat- ed that the mean oblate – prolate index for river pebbles are above – 1.5, while beach pebbles have lower values. The ap- propriate lower index limits of form indices for fluvial pebbles are thus; sphericity = 0.65 / or 0.66, coefficient of flatness = 45, and oblate – prolate index = -1.5.The calculated form indices are shown in Table 4 and the roundness data in Table 5. Table
4a shows that the means of two of the three indices (sphericity
and coefficient of flatness) are above the lower limits for fluvial pebbles, for only three of the locations studied, while they are below these limits at the other two locations. Table 4 also shows that the means for the oblate – prolate index are above the lower limits for fluvial pebbles for all the locations. Plots of coefficient of flatness against sphericity show that pebbles from three locations lie in the fluvial field, while pebbles from the other two locations plot in the beach field of [32] (Fig. 3a – e). All the means, too, plot likewise (Fig. 3f). The mean values of maximum sphericity of the pebbles range from 0.532 to 0.723. The mean values of coefficient of flatness obtained for the pebbles in this study range from 32.74 to 50.82. These values
dominant SSW mode and subordinate WSW, WNW, ENE and ESE modes (Fig. 6). The southwesterly paleocurrent suggests a northeasterly provenance of source area, which has been attributed mainly to igneous and metamorphic complex of the Cameroun highlands, with little contribution from the Abakaliki Folded belt [14], [15]. Ladipo [18] suggested that the dominant SSW mode as being discordant to the northeasterly source area, which he attributed to tidal processes within the deposi- tional basin. The minor ENE, ESE, WSW and WNW modes are indicative of reversals in current directions during the deposi- tional history of the sandstone. Such current reversals are sig- natures of tidal settings.
The sedimentary structures observed in the Ajali Formation are
indicative of tidal deposition in a shelf setting [16], [5]. These features include bimodal – bipolar paleocurrents, abundant occurrence of reactivation surfaces, common occurrence of herringbone cross bedding which is indicative of current rever- sals, laterally extensive low relief erosion surfaces overlain by thin granule or pebble lags or silt / mud drapes, paucity of mudrocks and their high mineralogical maturity and considera- ble lateral extent as shown by regional studies [2], [18]. The sedimentary facies of the Ajali Formation is suggestive of dep- osition in both tidal (sand flats, mixed flats, mud flat, and tidal
IJSER
plot across the fluvial and beach fields, which is suggestive of
an influence of both fluvial and shallow marine (beach) pro-
cesses. Plots of sphericity against oblate – prolate index (Fig.
4), following [36] method suggest that the majority of the peb-
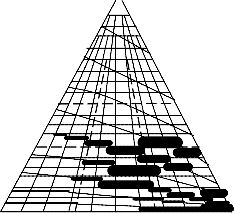
bles fall in the fluvial field. The oblate – prolate index calculated for pebbles in this study range from 0.159 to 2.818, which is above the – 1.5 minimum, required for pebbles formed in fluvi- al environments. Sneed and Folk [31] and Els [8] suggested that the sphericity of quartz pebbles decrease with increasing size. The sphericity values listed in Table 4B-F; do not appear to follow this pattern. Plots on the sphericity form diagram of Sneed and Folk (1970) (Fig. 9) for the – 2.0, - 2.5, - 3.0, - 3.5, -
4.0, - 4.5, - 5.0 and – 5.5 phi classes for the five locations stud-
ied do not give any significant trend. This may be explained from the fact that the pebbles are very close to their source area and have not experienced much shaping by fluvial ac- tion.[6] suggested the values of 0.375 and 0.508 as the mean value of roundness for river and beach environments. In this study, the [17] visual method was used in estimating round- ness. Thus results of roundness from this study were not com- pared with that of [6]. The roundness values from this result ranges from 0.311 ± 0.127 to 0.498 ± 0.118. Sneed and Folk [31], suggested that roundness increases in a downstream direction from a mean value of 0.542 upstream, 0.618 mid- stream and 0.633 in the downstream reaches. Thus, the roundness values of pebbles in this study suggest a very short distance of transport.
Bivariate plots of skewness against standard deviation (Fig.
5a) and mean diameter against standard deviation (Fig. 5b)
supports a fluvial origin for the sandstones of the Ajali Formation.
The paleocurrent direction is generally southwesterly with a
channel) and fluvial (point bar and floodplain) settings. The
Skolithos and Cruziana ichnofacies are indicative of a high
energy depositional environment, in the tidal and sub tidal parts of beaches, while the Glossifungites ichnofacies sug- gests deposition in a shallow water setting.
This study has shown that the Ajali Formation is a product of fluvial transport and tidal current energy. The paleocurrent analysis suggests that the sediments were sourced from the Abakaliki Anticlinorium and Cameroun highlands and trans- ported by rivers to the coastline where they are shaped by tidal current energy (Fig. 10). According to [23] major critical factors that initiated the tidal currents include the shape of the coast- line, shelf bathymetry and wave dynamics, governed by the prevailing wind direction and determined by the nature of the longshore drift. During the Maastrichtian times, the Anambra shelf was funnel shaped and has an extremely wide, low gra- dient slope. Elliot [7] and Schopt [30] have suggested the width and slope of paleo-shelves as critical paleogeographic factors influencing tidal effects. Nwajide and Reijers [23] attributed the tidal currents generated during the Maastrichtian times to have originated by a convergence of two drift cells, a southwest to northeast directed drift cell and a southeast to northwest di- rected drift cell, towards the apex of the funnel shaped Anam- bra shelf. Again the structural grains brought in by the rivers might have constricted and enhanced sedimentation dominat- ed by tidal current energy during those times when circulation is controlled by transgressive tendencies. During the regres- sive phases, the input from the proto-rivers dominates, leading to a gradual closing and smoothing out of the funnel shaped estuary.
.
IJSER © 2013 http://www.ijser.org
International Journal of Scientific & Engineering Research, Volume 4, Issue 12, December-2013
ISSN 2229-5518
2200
PEBBLE AXES
L : Long
I : Intermediate
S : Short .7
![]()
.6
COMPACT
C
0.9
0.70
0.70
- 5.0
S/L
CP CB CE
0.8 A B
![]()
- 4.5 .5
CB 0.80
C 0.80
![]() - 4.0
- 4.0
![]()
- 3.5
-3.0
-2.5
.4 P
.3
.2 VP
B E 0.7
0.6
S/L Ψp
0.50 S
0.70
0.50
Ψp
0.70
![]()
-2.0 .1
0
VE 0.5
0.4
0.3 0.30
B 0.60
B
0.30
0.60
. 0 . 1 . 2 . 3 . 4 . 5 .6 . 7 .8 . 9 .10
0.33 0.50 0.67
0.33 0.50 0.67
PLATY
0.70
BLADED
ELONGATED
0.70
0.70
C D E
S/L0.50
C 0.80
Ψp
0.70
S/L
0.50
C 0.80
Ψp
0.70
S/
0.50
CB 0.80
Ψp
0.70
IJSER
0.30
0.60
B
0.30
B 0.60
0.30
B 0.60
0.33 0.50 0.67
0.33
0.50
0.67
0.33 0.50 0.67
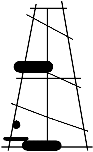
Fig. 9: - Sphericity – form diagram of Sneed and Folk (1958), Sphericity – form plots of mean
indices of the – 2.0, - 2.5, - 3.0, - 3.5, - 4.0, - 4.5 and – 5.0 phi size classes for the five locations studied.
Nkporo
Abakaliki Anticlinori-
Mamu
Formation
Ajali
Formation
Anambra
Cameroun High-
Fig. 10: 3 – D Paleogeographic model of the Ajali Formation
IJSER © 2013 http://www.ijser.org
International Journal of Scientific & Engineering Research, Volume 4, Issue 12, December-2013
ISSN 2229-5518
2201
6 CONCLUSIONS
On the basis of the mean sphericities and coefficient of flat- ness obtained for the five sets of pebbles of the Ajali For-
mation, it is concluded that the pebbles were shaped in both fluvial and marine environments. Plots of coefficient of flatness
against sphericity, and sphericity against oblate – prolate in- dex indicate that the pebbles were formed in both fluvial and
beach settings. Mean roundness indices computed for the pebbles are suggestive of a short transportation distance. The
results of the grain size or textural analysis are suggestive of a fluvial origin for the sandstones of the Ajali Formation. The
paleocurrent analysis suggests a northwesterly provenance of source area. The sedimentary facies is indicative of a mixed
tidal / fluvial setting. The tidal subenvironments include sand flats, mixed flats, mud flats and tidal channel, while the fluvial
subenvironments are point bars and floodplain deposits.
[1] O.K. Agagu, E.A. Fayose, and S.W. Petters, 1985.
Stratigraphy and sedimentology of the Senonian
Anambra Basin of Eastern Nigeria. Nigerian Journal of Mining and Geology, v.22, p. 25 – 26.
[2] L.C. Amajor, 1984. Sedimentary facies analysis of the
Ajali Sandstone (Upper Cretaceous), Southern Benue
Trough. Nigerian Journal of Mining and Geology, 21(1
tion of beach and river sands. Journal of Sedimentary
Petrology, 37, pp 327 – 354.
[13] G.M. Friedman, 1979. Differences in size distributions
of populations of particles among sands of various or- igins. Sedimentology, 26, pp 3 – 32.
[14] M. Hoque, and M.C. Ezepue, 1977. Petrology and paleogeography of Ajali Sandstone. Nigerian Journal
of Mining and Geology, 14 (1), pp. 16 – 22.
[15] M. Hoque, and C.S. Nwajide, 1985. Tectono – sedi-
mentological evolution of an elongate intracratonic basin (Aulacogen): The case of the Benue Trough of Nigeria. Nigerian Journal of Mining and Geology, 21 (1&2), pp. 19 – 26.
[16] G. de V. Klein, 1990. Trace fossils in the Chalk envi- ronment. In: Crimes, T.P. and Harper, J.C. (eds.). Trace fossils. Geol. Jour. Spec. Publ. 3: 236 – 282.
[17] W.C. Krumbein, 1941. Measurements and geological
significance of shape and roundness of sedimentary particles. Journal of Sedimentary Petrology, 11, pp. 64
– 72.
[18] K.O. Ladipo, 1986, Tidal shelf depositional model for
the Ajali Sandstone, Anambra basin, Southern Nige- ria. Journal of African Earth Sciences, 5 (2), pp. 177 –
185.
[19] G. Lutig, 1962. The shape of pebbles in the continen-
tal, fluviatile and marine facies. Int. Assoc. Sci. Hydrol. Publ., 59, pp. 253 – 258.
IJSER
and 2), pp. 171-176.
[3] C.O. Awalla, and C.C. Ezeh, 2004. Paleoenvironment of Nigeria’s Ajali Sandstone: A pebble Morphometric Approach. Global Journal of Geological Sciences,
2(1), pp. 37 – 43.
[4] I. Banerjee, 1979. An analysis of cross-bedded se- quences; An example from the Ajali Sandstone (Maastrichtian) of Nigeria. Journal of Geological Soci- ety of India, 51 (2), pp. 69 – 81.
[5] R.W. Dalrymple, 1992. Tidal depositional systems. In
Walker, R.G. and James N.P. (ed.) Facies models: re- sponse to sea level change. Geol. Assoc. Canada.
195 – 217.
[6] J.E. Dobkins and R.L. Folk, 1970. Shape develop-
ment of Tahiti- Nui: Journal of Sedimentary Petrology,
40, pp. 1167 – 1203.
[7] T. Elliot, 1978, Clastic shorelines, in H.G. Reading, Sedimentary Environments and Facies: Elsevier, New York, pp. 143 – 177.
[8] B.G. Els, 1988. Pebble Morphology of an ancient con-
glomerate: The Middelvlei Gold Placer, Witwaters- rand, South Africa. Journal of Sedimentary Petrology.
58 (5), pp. 894 – 901.
[9] R.L. Folk, 1974. Petrology of sedimentary rocks.
Hemphill Publishing Company, Austin Texas, 182p.
[10] R. L. Folk, & W. C. Ward, 1957. Brazo River bar: A
study in the significance of grain size parameters.
Journal of Sedimentary Petrology, 27, 3-26
[11] G.M. Friedman, 1961. Distinction between dune, beach and river sands from their textural characteris- tics, Journal of Sedimentary Petrology, 31, pp 514 –
529.
[12] G.M. Friedman, 1967. Dynamic processes and statis- tical parameters compared for size frequency distribu-
[20] C.C. Mason, and R.L. Folk, 1958. Differentiation of
beach, dune, and tidal flat environments by size anal-
ysis, Mustang Island, Texas. Journal of Sedimentary
Petrology. 28, pp. 211 - 226.
[21] R.J. Moiola, and D. Weiser, , 1968. Textural parame-
ters; An Evaluation. Journal of Sedimentary Petrology,
33, pp. 45 – 53.
[22] C.S. Nwajide, and M. Hoque, 1982. Pebble Mor- phometry as an aid in environmental diagnosis: an example from the Middle Benue Trough, Nigerian Journal of Mining and Geology, 19 (1), pp. 114 – 120.
[23] C.S. Nwajide and T.J.A. Reijers, , 1996. Anambra ba- sin Excursion Guide. In Reijers, T.J.A. (ed.). Selected Chapters on Geology, pp. 149 – 197.
[24] C.F.R. Odumodu, and B.E. Ephraim, 2007a. Paleoen-
vironmental analysis of the Nsukka Formation, using pebble morphology. Natural and Applied Sciences Journal, 8 (1), pp. 73 – 84.
[25] C.F.R. Odumodu, and B.E. Ephraim, 2007b. Pebble
Morphometry as an indicator of the depositional envi- ronment of the Ajali Sandstone. Natural and Applied Sciences Journal. 8 (2), pp. 132 – 143.
[26] S.W. Petters, 1978. Stratigraphic evolution of the Be-
nue Trough and its implications for the Upper Creta- ceous paleogeography of West Africa: Journal of Ge- ology, v. 86, p. 311 – 322.
[27] H.G. Reading, & J.D. Collinson, 1996. Clastic coasts.
In Reading, H.G. (eds). Sedimentary Environments: Processes, Facies & Stratigraphy. Blackwell Science Ltd, Oxford, London, p. 154 – 231.
[28] R.A. Reyment, 1965. Aspects of the Geology of Nige-
ria. Ibadan. University Press, Nigeria. 145 p.
[29] C.W. Sames, 1966. Morphometric data of some re- cent pebble associations and their application to an-
IJSER © 2013 http://www.ijser.org
International Journal of Scientific & Engineering Research, Volume 4, Issue 12, December-2013
ISSN 2229-5518
2202
cient deposits. Journal of Sedimentary petrology, 36, pp. 126 – 142.
[30] T.J.M. Schopt, 1980. Paleoceanography: Harvard
University Press, Cambridge, 341 p.
[31] E.D. Sneed, and R.E. Folk, 1958. Pebbles in the low-
er Colorado River, Texas: a study of particle morpho- genesis. Journal of Geology, 66, pp. 114 – 150.
[32] T. Stratten, 1974. Notes on the application of shape parameters to differentiate between beach and river
deposits in Southern Africa. Trans. Geological Society of South Africa, 77, pp. 59 – 64.
[33] R.G. Thomas, , D.G. Smith, , J.M. Wood, , , J. Visser, E.A. Calverley-Range, and E.H. Koster, , 1987. In-
clined Heterolithic stratification – terminology, descrip- tion, interpretation and significance. Sedimentary Ge-
ology. 53, pp. 123 – 179.
[34] M.E. Tucker, 1981. Sedimentary Petrology; An Intro-
duction. John Wiley and Sons Inc., New York, 25
IJSER
IJSER © 2013 http://www.ijser.org