International Journal of Scientific & Engineering Research, Volume 4, Issue 12, December-2013 140
ISSN 2229-5518
A PARAMETRIC STUDY OF SOLAR AND WIND ENERGY IN GAZA STRIP
ABSTRACT
Juma Yousuf Alaydi
The integration of renewable such as solar and wind energy is becoming increasingly attractive and is being used widely, for substitution of oil-produced energy, and eventually to minimize atmospheric degradation. Hourly wind-speed data recorded at automatic solar radiation and meteorological monitoring station has been analyzed to determine monthly wind power and solar radiation. The wind power was compared with the monthly mean solar radiation energy. The site of Gaza city has the highest wind energy potential compared to the other sites with annual wind speed average of 4.2 m/s and with wind speed higher than
5.0 m/s for about 60% of the time. Typical Meteorological Year files (TMY) based on the direct solar beam component, and archived hourly data upon which they are based. The average annual direct beam total is 2196 kWh m-2 year-1. The annual
maximum attainable wind power potential per unit area of the wind stream is 0.5 MWhr/m2/year and the annual solar potential per unit area of the earth surface is 2.03 MWhr/m2/year. The monthly average daily energy generated from the above hybrid system configuration has been presented. The deficit energy generated from the back-up diesel generator and the number of operational hours of the diesel system to meet a specific annual electrical energy demand. The study has investigated the performance of simulated hybrid systems consisting of 10 kW WECS, machines and 25 m2 of photovoltaic solar array panels supplemented with battery storage systems and diesel back-up. The monthly average daily energy generated from the above hybrid system configuration has been presented.
Keywords: Wind energy, solar energy hybrid system renewable energy, Gaza
1- Introduction
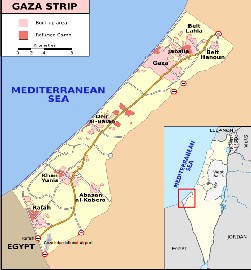
The Gaza Strip is a narrow strip stretches along the east- south corner of the Mediterranean. It borders Egypt on the south-west as shown in Fig. 1. It is about 41 kilometers long, and between 6 and 12 kilometers wide, with a total area of 360 square kilometers. It lies on Longitude 34o 26` east and Latitude 31o 10` north of the equator. The Gaza Strip is highly populated with an estimated population of 1.5 million. The average population density is 2330 person per km2, while the highest, who is registered in the camps, can be 100,000 people per km2. The territory takes its name from Gaza, its main city. Gaza International Air Port is located in the southern part of Gaza Strip, in Rafah 36 kilometers from Gaza city close to the Egyptian border. The Gaza Strip is categorized as tropical region with a relatively hot summer and mild winter [1].
Wind energy is one of the most attractive, clean, promising
potential source of alternative/renewable energy options
that is being vigorously pursued by a number of developed
and developing countries (with average wind speeds of 5
m/s) in an effort to reduce their dependence on fossil- based non-renewable fuels [1-12].
A Typical Meteorological Year (TMY) consists of twelve monthly files of actual hourly meteorological data selected in a particular manner [1]. The months will not, in general,
have come from the same year. Instead, each will have been chosen as being a “typical” representative of the month in
question and, ideally, the choice for each will have been made from very many years of accumulated data.
The reason for taking actual months of data rather than averaged files is that the former preserve correlations (both known and unknown) that exist among the different measured parameters (e.g. solar radiation and ambient temperature) and also correlations that exist over a period of several days among values of any given parameter. Design of active solar space-heating systems is usually based on selecting one type of collector system, usually a flat-plate collector, and designing the auxiliary components to fit that collector system. The type of climate at the location of utilization is not often considered when designing such a solar system. Therefore, a solar system may exhibit a high performance in some areas but low performance in others. Before making an investment decision, it is essential to investigate the solar energy characteristics of the particular location at which the solar energy system is to be used. This includes examination of the nature of the correlations between solar radiation and temperature, so that an optimal design of solar energy system can be established for the particular region [2].
Fig. 1 shows the locations of the meteorological stations
involved in the Gaza Radiation Survey. Also, presently
thousands of photovoltaic (PV) deployments (with monthly
average daily solar insolation level in the range of (3
kWh/m2 – 6 kWh/m2 ) exist worldwide, providing power to small, remote grid independent or stand-alone applications
IJSER © 2013 http://www.ijser.org
International Journal of Scientific & Engineering Research, Volume 4, Issue 12, December-2013 141
ISSN 2229-5518
[6,7]. Standalone commercial WECS (in spite of remarkable technological advancements) do not produce usable energy for a considerable portion of time during the year. This is mainly due to relatively high cut-in wind speeds (speed at which WECS starts producing usable energy) which range from 3.0 to 4.0 m/s. In order to overcome this downtime, use of hybrid wind+ solar systems has been recommended in the literature. Although solar energy is environmentally benign and available in abundance, a stand-alone PV system is an expensive option. Another principal shortcoming of the stand-alone PV system is the dependence on variable sunshine hours and the resulting short capacity utilization as well as the need for energy storage and back-up systems [8].
contribution of PV is small as compared to the share of wind [12]. The prospects of derivation of power from hybrid renewable (wind+ solar+ diesel) sources of energy are proving to be very promising world-wide [13–21].
Gaza's electricity supply is made up of 144MW from Israel,
17MW from Egypt and 80MW from Gaza power generation
plant (GPG). The GPG fuel is usually brought through the
main fuel entry point between Gaza and the Israeli side.
The GPG plant has shut down completely several times
after running out of fuel because the crossing was closed. It was out of fuel for most of the Israeli war on Gaza in January 2009, leaving two-thirds of Gaza without power. Since early 2008, the power plant has received enough fuel to operate at only about two-thirds of its capacity. In April and May 2010, fuel supply fluctuated, with the plant able to operate at between 20 and 50% of its capacity. Power cuts remain frequent. Research by Oxfam in April 2010 showed that houses across Gaza were without power for 35-60 hours a week.
The peak system demand at Gaza, Gaza Strip is 250 MW [18]. Since Gaza is enriched with a high insolation level and medium wind regime, a considerable fraction of its energy requirements may be tapped from a hybrid combination of
wind and solar energy. The use of these alternative sources
of energy reduces combustion of fossil fuels and the consequent CO2 emission which is the principal cause of the greenhouse-effect/global warming [19]. Global warming is a pressing international/environmental issue which has become a decisive factor in energy planning. In the wake of this problem, and as a remedial measure, strong support is expected from renewable such as solar and wind energy [8]. The wind/solar/diesel based power
Fig.1: Gaza Strip
Stand-alone diesel generator sets, while being relatively inexpensive to purchase, are generally expensive to operate and maintain especially at low load levels [9]. In general, the variations of solar and wind energy generation do not match the time distribution of the demand. Therefore power generation systems dictate the association of a battery storage facility to smoothen the time-distribution- mismatch between the load and solar/wind energy generation and to account for maintenance/outages of the systems [10]. More importantly, stand-alone WECS or PV (if used independently) would have to be oversized to make them completely reliable resulting in higher total cost. However, a mixture of solar and wind energy into a hybrid generation system can attenuate their individual fluctuations, increase overall energy output, reduce energy storage requirements and diesel consumption considerably. It has been shown that because of this combination the overall expense for autonomous systems may be reduced drastically for a large number of cases [11]. Wind and solar systems are expandable additional capacity may be added as the need arises. In view of system costs (wind is
$1000/kW, PV is $4000/kW, battery is $170/kWh), the
generation is becoming a viable, cost-effective approach for
remotely located communities (that need an independent
source of electrical energy) where it is uneconomical to
extend the conventional utility grid. Also investments in mobilization of wind/PV power can stimulate the local economy by making use of available local resources [5]. Gaza Strip, have been analyzed to explore the feasibility of using hybrid (wind+ solar+ diesel) energy conversion systems at Gaza city to meet the energy needs of a group of twenty typical 2-bedroom family houses. An attempt has been made to address the energy generated by the hybrid systems of different components (wind turbine capacity, PV area, and storage capacity). The diesel back-up system is operated at times when the output from wind+ solar systems fails to satisfy the load and when the battery storage is depleted.
2- Wind/solar data and operational strategy of the system:
a. Wind energy potential
The data on wind speed, direction and frequency
distribution are used to analyze wind energy characteristics
and availability at some stations in Gaza Strip. Since most
of the available wind data measurements have been made
IJSER © 2013 http://www.ijser.org
International Journal of Scientific & Engineering Research, Volume 4, Issue 12, December-2013 142
ISSN 2229-5518
close to 10 m in height, thus it was extrapolated to 50 m height. The vertical extrapolation was based on the power- law expression, and the wind energy and potential have been estimated at the wind generator hub height of approximately 50 m. These estimations are based on data from two meteorological stations
As an example for the evaluation of energy potential,
using the developed program, one defined region was
chosen. Table 1 contains the wind data measured for Gaza
city. This table includes Overall monthly hourly mean wind speeds (m/s) and power density (W/m2). The overall
monthly variation of mean wind speed and wind power density provides information on the availability of wind during different months of the year. The overall monthly maximum and mean values of hourly wind speed at 50 m height during the collection periods are summarized in Table 1. The table also shows the corresponding mean values of wind power densities. The table shows that Gaza has annual mean wind speed of 4.2 m/s.

Table 1: The overall monthly maximum and mean values of hourly wind speed at 50 m height
Gaza City
IJSER
Furthermore, the monthly means wind speed for Gaza were 4 m/s or more for 8 months of the year reaching above
4.5 m/s for few months of the year; the wind speed is higher during the winter months when electrical load is high at such cold climates.
b. Wind energy calculations
The available wind energies E (MWh/km2) that could be extracted from rotors of unit area at a height of 50 m above ground for the two stations under concentration are calculated in [1]. The results together with the annual values for Gaza city is shown in Table 3.
Table 2: The calculated wind energy potential for Gaza City
Month | Average Power Intercepted MW/km2 | Average Power Output MW/km2 | Annual Energy Production MWh/km2 |
Jan | 3.61 | 6.77E+05 | 5.93E+03 |
Feb | 1.99 | 3.74E+05 | 3.28E+03 |
Mar | 3.60 | 6.74E+05 | 5.91E+03 |
Apr | 9.42 | 1.77E+05 | 1.55E+03 |
May | 2.76 | 5.18E+05 | 4.54E+03 |
Jun | 2.59 | 4.86E+05 | 4.26E+03 |
Jul | 3.55 | 6.66E+05 | 5.83E+03 |
Aug | 2.61 | 4.89E+05 | 4.28E+03 |
IJSER © 2013 http://www.ijser.org
International Journal of Scientific & Engineering Research, Volume 4, Issue 12, December-2013 143
ISSN 2229-5518
Sep | 1.79 | 3.36E+05 | 2.94E+03 |
Oct | 1.71 | 3.21E+05 | 2.81E+03 |
Nov | 2.75 | 5.15E+05 | 4.52E+03 |
Dec | 2.80 | 5.24E+05 | 4.59E+03 |
Annual | 2.92 | 5.48E+05 | 4.80E+03 |
The annual energy that can be generated at the two sites by a Nordex N43/600 wind machine was obtained using wind power curve of the machine Considering the
presented in [21]. The PV modules which are composed of
many solar cells are integrated to form a solar array. The
hourly energy generated (E, kWh) from the PV system is
calculated using the equation (1):
𝐸 = 𝐴𝜂𝑚 𝑃𝑓 𝜂𝑝𝑐 𝐼 (1)
number of turbines per km2 equals 8 with a diameter of
where A is the array area in m2 , ηm
is the module reference
d=50 m, efficiency and energy loss are equal to 0.25 each
(the energy losses caused by turbine wakes, blade soiling
and electrical losses caused by transformation and
collection systems, etc). [12]. The technical data of the wind
machine used is summarized in Table 2. Since the hub
heights of the wind machine is 50 m, the hourly mean wind speed values were calculated at that height using 1/7th power law.
c. Solar energy calculations
The energy calculations are made by using the hourly solar radiation data and a given PV array area. The
efficiency (0.111), Pf is the packing factor (0.9), ηpc is the power conditioning efficiency (0.86), and I is the hourly insolation (kWh/m2 ). Today’s best PV systems can achieve an overall efficiency of about 12% [5]. These lower efficiency values may not make this alternative (PV systems) attractive at the moment. However it may be mentioned that technological breakthroughs may change the scenario [10]. The monthly direct beam averages (kWh m-2 day-1). Months indicated in bold print were used for TMY Underlined months excluded from consideration is shown on Table 3.
characteristics of some of thIe comJmercial PV mSodules are ER
Table 3: Gaza monthly direct beam averages (kWh m-2 day-1).
| 1989 | 1990 | 1991 | 1992 | 1993 | 1994 | 1995 | 1996 | 1997 | 1998 | 1999 | 2000 | 2001 | 2002 | Mean | Sigma |
JAN | | | | 2.83 | 2.83 | 2.92 | 3.97 | 2.85 | 3.64 | 3.48 | 3.63 | 3.08 | 4.49 | 3.22 | 3.36 | 0.54 |
FEB | | | | 2.26 | 2.94 | 4.50 | 5.53 | 2.98 | 4.89 | 4.36 | 3.96 | 4.99 | 4.37 | 4.92 | 3.97 | 0.92 |
MAR | | | | 2.52 | 4.01 | 3.72 | 5.02 | 4.65 | 4.40 | 3.30 | 5.39 | 5.54 | 4.54 | 4.46 | 4.33 | 0.90 |
APR | | | | | 5.32 | 5.29 | 5.14 | 4.69 | 5.03 | 5.87 | 5.83 | 4.41 | 4.41 | 4.90 | 5.19 | 0.46 |
MAY | | | | | 4.50 | 6.45 | 6.20 | 6.45 | 6.97 | 5.41 | 6.64 | 7.74 | 7.74 | 7.43 | 6.46 | 0.94 |
JUN | | | | 7.06 | 7.69 | 7.36 | 7.41 | 8.15 | 7.82 | 7.45 | 7.42 | 8.75 | 8.75 | 8.43 | 7.78 | 0.52 |
JUL | | 3.57 | | 7.44 | 7.18 | 7.02 | 6.66 | 4.86 | 7.72 | 8.15 | 7.41 | 6.81 | 7.73 | 7.84 | 7.40 | 0.48 |
AUG | | | | 6.11 | 6.73 | 6.75 | 6.76 | 6.26 | 7.23 | 6.96 | 7.25 | 6.40 | 6.78 | 7.15 | 6.76 | 0.38 |
SEP | | | | 5.59 | 5.80 | 5.16 | 5.40 | 5.49 | 6.67 | 6.12 | 6.29 | 6.05 | 6.01 | 6.01 | 5.88 | 0.44 |
OCT | | | | | 4.92 | 4.04 | 5.12 | 4.62 | 4.26 | 5.86 | 5.66 | 3.95 | 4.18 | 4.18 | 4.73 | 0.66 |
NOV | | 4.72 | | | 3.49 | 3.41 | 4.56 | 3.52 | 4.65 | 4.36 | 4.84 | 5.08 | 4.24 | 4.53 | 4.31 | 0.58 |
DEC | | 3.29 | | | 2.86 | 3.51 | 3.65 | 3.62 | 3.64 | 3.76 | 4.34 | 3.33 | 3.64 | 3.14 | 5.53 | 0.38 |
ANN | | | | | 4.87 | 5.01 | 5.30 | 4.84 | 5.58 | 5.43 | 5.73 | 5.41 | 5.66 | 5.52 | 5.34 | 0.32 |
IJSER © 2013 http://www.ijser.org
International Journal of Scientific & Engineering Research, Volume 4, Issue 12, December-2013 144
ISSN 2229-5518
9
8
7
6
5
4
3
2
1
0
1 2 3 4 5 6 7 8 9 10 11 12
Month
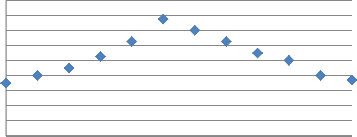
Fig. 2: Mean monthly daily average direct beam insolation for Gaza in the Radiation Survey (1989-2002)
Table 4: Relative ranking of Gaza Radiation Survey according to average annual direct beam data (column 2). This ranking is relevant to solar-concentrator systems. Also shown is the slightly different ranking resulting from the corresponding TMY files (column 3)
Table 5: Relative ranking of the Radiation Survey stations according to TMY annual global horizontal totals. This ranking is relevant to non-concentrator systems.
Station | TMY annual global horizontal total (kWh m-2 year-1) |
Gaza | 1905 |
3- Hybrid system.
In general, the cut-in wind speed of most of the
CWMs is 4 m/s. The probability distribution of
wind speed (PDWS) at Gaza is less than 4 m/s for
about 25% - 30% of the time during the year. This
indicates that a stand-alone WECS installed at Gaza will not produce any energy for about 25% of the time. In order to overcome this downtime, a diesel back-up or a large energy storage system may be needed to meet the required load. The capacity of the storage system can be minimized by using a PV system along with the WECS. The mode of operation of the present hybrid system (in the simulation) is as follows: in normal operation the WECS+PV feed the load demand. The excess
energy (the energy above the average daily
demand) from the WECS+PV is stored in the
battery until the full capacity of the storage system is reached (i.e. until the battery gets fully charged). The main purpose of introducing battery storage is to import/export energy depending upon the situation. In the event that the output from WECS+PV exceeds the load demand and the battery’s state of charge is maximum, then the excess energy is drained away or fed to some dump load. A diesel backup system is used to support the WECS+PV in meeting the demand when the battery storage is depleted (i.e. when WECS+PV+ storage systems fail to manage the demand).
Table 6. Monthly Energy (kWh) to be generated from Back-up Diesel System and number of hours of Operation of the Diesel
System (mentioned in parentheses)
Jan. | Feb. | Mar. | Apr | May | June | July | Aug. | Sep. | Oct. | Nov. | Dec. |
0 | 0 | 0 | 30 (10) | 50 (15) | 70 (30) | 90 (55) | 140 (60) | 80 (45) | 31 (15) | 0 | 0 |
IJSER © 2013 http://www.ijser.org
International Journal of Scientific & Engineering Research, Volume 4, Issue 12, December-2013 145
ISSN 2229-5518
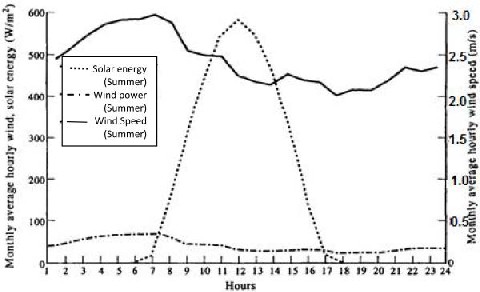
Fig. 3 Diurnal variation of wind speed, wind energy and solar radiation for a winter month
4- Results and discussion
An important driving element of any power generating
system is load. As a case study and as a representation of
the period 1989-2010, is presented in Fig. 4. The monthly average daily values of energy generated for the above
scenario, for the year 1992 are plotted in Fig. 4. This Fig.
IJSER
residential buildings, the measured annual average energy
consumption (based on 5 years of data) of twenty typical
centrally family houses (floor area=170 m2), in Gaza, has
been considered as yearly load (4000 kWh) in the present
study. This load could also be a representation of a group
of remotely located houses which do not have access to the utility grid (even today, there are many communities living/dwelling in small pockets in remote locations of Gaza Strip). The projected monthly average daily load profile is shown in Table 3. As depicted in this table, the load seems to peak during June to September.
The hybrid systems simulated in the present investigation
consist of 3 kW WECS, machines and 25 m2 of photovoltaic
solar array panels supplemented with battery storage
systems and diesel back-up. The wind speed (hence wind
energy) varies considerably from one year to another. In order to show the variation of wind power and eventually hybrid power, the monthly average daily hybrid energy for
shows the monthly distribution of solar, wind, as well as
hybrid power. Also it can be noticed, that either the
selected stand-alone PV or WECS cannot cope up with load
in the months June and December. This deficiency is taken
care partially by the hybrid system. The remaining energy
needed to match the load could be supplied either from the battery or diesel generator or from both. The battery storage capacity required to meet the demand will be very large and very costly. The use of diesel system alone may result in frequent start/stop cycles of the diesel generator [frequent startups/stops promote wear]. However the hybrid energy together with energy from the battery is not sufficient to manage the peak demand during June and December. This offset in power is compensated by a diesel back-up.
IJSER © 2013 http://www.ijser.org
International Journal of Scientific & Engineering Research, Volume 4, Issue 12, December-2013 146
ISSN 2229-5518
Fig. 4 Monthly distribution of solar, wind, and hybrid power
In the simulation, the excess energy (the energy above the average daily demand) from the hybrid system is stored in
shows that the potential of renewable energy option of hybrid energy cannot be overlooked at Gaza; a considerable
IJSER
the battery until the full capacity of the storage system is
reached [i.e. until the battery gets fully charged]. However
the excess energy is drained away when the battery’s state
of charge is maximum. A diesel back-up system is used to
support the hybrid system in meeting the daily demand when the battery storage is degraded. The monthly energy to be provided by the diesel system and the no. of hours of operation of the diesel system (to meet the monthly load) is shown in Table 1. In general, the battery’s state of charge is almost minimum during the months August to October for the simulated period 1989-2010. Moreover maximum amount of energy from the diesel back-up system needs to be produced in July, August and September to satisfy the demand. It should be recognized that a portion of the energy produced will go unused due to a lack of demand especially during the months Jan. to June and December.
5- Conclusion
The study has investigated the performance of hybrid
systems consisting of 3 kW WECS, machines and 25 m2 of
photovoltaic solar array panels supplemented with battery storage systems and diesel back-up. It has been observed that the wind turbine with a rated power close to peak load gives the best wind energy utilization factor. The results reveal that, with 3 kW of wind turbine capacity, the PV of
25 m2 decreases the diesel generated energy by 11 and
12.4% respectively. It has been noticed, that a large stand-
alone PV or WBCS will be required to meet the peak load in
the months June to September. However this deficiency is
taken care by the hybrid system. The back-up Diesel
system, used in the study, (to minimize battery storage) generates about 11% of the yearly energy requirement, to match the load distribution. The present investigation
amount of its energy demand may be tapped from hybrid
systems. The study recommends a parametric study similar
to the one investigated in the present paper and followed
up by an economic analysis for designing stand alone
renewable energy systems. References
[1] Juma Yousuf Alaydi, A Survey on the Assessment of Wind Energy Potential in Gaza Strip; Wind Engineering; Multi Science Publishing; ISSN 0309-524X (Print); Renewable Energy and Wind Power; Issue; Volume 34, Number 5 / October 2010.
[2] Juma Yousuf Alaydi, The solar energy potential of Gaza Volume 11 Issue 7 Version 1.0 December
2011 Double Blind Peer Reviewed International Research Journal Publisher: Global Journals Inc. (USA ISSN: 0975-5861.
[3] Daoo VJ, Panchal NS, Faby S, Sitaram V,
Krishnamoorthy TM. Assessment of wind energy potentialof Trombay, Mumbai, India. Energy Convers Manage 1998; 39(13):1351–6.
[4] Nayer CV, Thomas FP, Phillips SJ, James WL.
Design considerations for appropriate wind
energy systems in developing countries. Renew
Energy 1991; 1(5/6):713–22.
[5] Linda B. Wind power: today’s energy option.
Solar Today 1990; July/August: 10–3.
[6] Rizk J, Nagrial MH, Mitchell K. Wind energy in
Australia. In: Proceeding Abstracts, 7th Arab International Solar Energy Conference, Sharjah, UAE, 19–22 February. 2001. p. 235–6.
IJSER © 2013 http://www.ijser.org
International Journal of Scientific & Engineering Research, Volume 4, Issue 12, December-2013 147
ISSN 2229-5518
[7] Bellarmine TG, Joe U. Wind energy for the 1990s and beyond. Energy Convers Manage 1996;
37(12):1741–52.
[8] Hansen U. Technological options for power
generation. Energy J 1998; 19(2):63–87.
[9] Nayer CV et al. Novel wind/diesel/battery
hybrid energy system. Solar Energy 1993;
51(1):65–78.
[10] Traca A. et al. Source reliability in a combined
wind–solar–hydro system. IEEE Trans Power
Apparatus System 1983; PAS-102(6):1515–20.
[11] Seeling GCH. A combined optimization concept
for the design and operation strategy of hybrid-
PV energy systems. Solar Energy 1997; 61(2):77–
87.
[12] Bergey M. Village electrification: hybrid systems.
In: Wind Energy Applications and Training
Symposium 1993, Amarillo, TX, 7 July. 1993.
[13] McGowan JG, Manwell JF. Wind/diesel energy
systems: review of design options and recent developments. Solar Energy 1998; 41(6):561–75.
[14] Cramer DG. Technology transfer allows China to build exotic power systems. Power Eng 1994;
February:33–5.
[15] Beyer GH, Langer C. A method for the identification of configurations of pv/wind hybrid systems
for the reliable supply of small loads. Solar Energy
1996;57(5):381–91.
[16] Bhatti TS, Al-Ademi AAF, Bansal NK. Load
frequency control of isolated wind diesel hybrid power systems. Energy Converse Manage 1997; June: 829–37.
[17] Ministry of Industry and Electricity. Electrical growth and development in the Kingdom of
SaudiA rabia. Riyadh, Kingdom of Saudi Arabia: Electrical Affairs Agency, 1997.
[18] Annual Report, Saudi Consolidated Electric
Company, Easter Province/Saudi Arabia, 1996–
1997,p. 15.
[19] Ali S. Global progress in renewable energy. In:
Proceeding Abstracts, 7th Arab International
Solar Energy Conference, Sharjah, UAE, 19–22
February. 2001. p. 4.
[20] Jeffery K. Global warming and energy efficiency.
Sun World 1990; 14(2):44–52.
[21] Elhadidy MA, Shaahid SM. Parametric study of hybrid (wind + solar + diesel) power generating systems. Int J Renew Energy 2000; 21:129–39.
IJSER © 2013 http://www.ijser.org