International Journal of Scientific & Engineering Research,Volume 3, Issue 6, June-2012 1
ISSN 2229-5518
P. Swami, T. Gandhi, S.S. Ray, S. Anand
Abstract— This paper illustrates a novel topology for the conditioning of electro-oculogram signals. The system is composed of a second order amplification chain and assures stability, speed and accuracy. The proposed configuration has been developed in order t o make signal acquisition of biological signals such as electro-oculogram simpler and robust with low cost. The filters between the pre- amplification and the amplification stages eliminate the out -of-band frequencies before amplification. This reduces the possibility of interferences from high frequency noises and maximizes the dynamic power consumption. The presente d topology holds clinical and rehabilitative control applications.
Index Terms— Elctro-oculogram (EOG), Corneal-retinal potential (CRP), Signal conditioning, Biopotential amplifier, Instrumentation amplifier, Embedded system, Ophthalmoscopy.
—————————— ——————————
he eye movements have attracted many researchers in the past. A seminal review of major types of eye movements [1] illustrates the advantages and the disadvantages of
various types of eye movement detection methods. To list a few, magnetic field search coil technique [2], Video Oculogra- phy (VOG) system and Infrared Oculography (IROG) are some of the commonly used eye movements’ detection sys- tems [3]. However since the electro-oculography (EOG) pro- vides an effective, low cost and non-invasive method for de- tection of full range of eye movements it has been a frequently used system in ophthalmoscopy. It is commonly used in for the diagnosis and prognosis of several diseases such as best’s disease [4] and multiple sclerosis [5]. Besides the clinical ap- plications of EOG, it has been the theme of research for devel- opment of assistive technologies by human-machine interface [6, 7].
The electro-oculogram is the measure of potential between the cornea and the retina of the eye called the corneal-retinal potential (CRP). This potential is generated due to the hyper- polarization and depolarization of retinal cells. During the process the cornea establishes a relatively positive potential with respect to the retina. Information about the changing po- sition and the speed of the eye movement can be acquired by the placement of electrodes around the eyes. The EOG is ac-
————————————————
![]() Tapan Gandhi is an INSPIRE faculty with the Dept. of Science and Tech-
Tapan Gandhi is an INSPIRE faculty with the Dept. of Science and Tech-
nology, Govt. of India and is currently a Post-doctoral Research fellow in the Dept. of Brain and Cognitive Sciences, MIT, USA.
![]() S. S. Ray is assistant professor with the Dept. of Biotechnology & Medical
S. S. Ray is assistant professor with the Dept. of Biotechnology & Medical
Engineering, National Institute of Technology Rourkela, Orissa, India. ![]() Sneh Anand is professor with the Centre for Biomedical Engineering, IITD
Sneh Anand is professor with the Centre for Biomedical Engineering, IITD
and AIIMS, New Delhi, India.
quired using a bi-channel electrode placement system, namely horizontal and vertical channels. The strength of the EOG sig- nal varies from 10- 30mV [8] with frequencies in the DC-10Hz band [9].
The recording of the EOG has been associated with several
problems [10]. In addition to EOG signal produced from the
eyeball rotation and movements it is also affected by different sources of artifacts like head movements, electro- encephalogram (EEG) signals, electrode placement, etc. Hence, it becomes necessary to develop an amplifier which eliminates the shifting resting potentials arising due to these artifacts and simultaneously avoid saturation. Most of the commercially available EOG amplifiers are costly and uses intricate design. Hence, the development of dedicated topology for the max- imization of overall circuit performance in a cost effective manner has been the motive behind this study. Additionally, this system follows the trend of integrating real-time embed- ded systems with wireless transmission for diagnostics [11,
12], making it more practicable to implement on newer and smaller platforms.
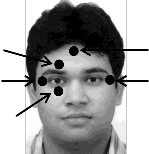
Two channels EOG amplifier was developed for the acquisition of horizontal and vertical eye movement signals. For the electrode placement scheme as shown in Fig. 1, the positive horizontal channel electrode (H1) was placed on the right canthus of the right eye and the negative horizontal channel electrode (H2) was placed on the left canthus of the left eye. And the positive vertical channel electrode (V1) was placed 2cm above the cornea and the negative vertical channel electrode (V2) was placed 1cm
IJSER © 2012
International Journal of Scientific & Engineering Research,Volume 3, Issue 6, June-2012 2
ISSN 2229-5518
below the cornea of the eye. The common reference signal was taken from the reference electrode (R) placed on the forehead.
+ ve Vertical channel
er module RX 02 was kept at the receiver end for the reception of the serial data. This serial data was decoded to its parallel form by the use of decoder IC HT648. The analog signal was
recovered to its original form by use of digital-to-analog con- verter IC DAC0800.
The experiment was conducted on 8 healthy right handed sub- jects (4 F, 4 M) of age between 20-26 years (with mean age=
(V1)
+ ve Horizontal channel (H1)
- ve Vertical channel (V2)
Reference (R)
- ve Horizontal channel (H2)
22.25 years). Before each experiment, the subject was asked to comfortably sit on a chair in a relaxed position with eyes closed while the electrodes were placed according to the illu- strated scheme.
Typically, the EOG signal consists of eye movements in the vertical, horizontal, diagonal directions and blinks. The blink
Fig 1. Electrode placement scheme used in the study.
The methodology for the designing of EOG biopotential amplifier has been explained in Fig. 2. For the study, instru- ment amplifier IC AD620 having an adjustable gain was used. Initially, out-of-band frequencies were removed by band pass filtering in the cutoff range between same that of the useful EOG signal range i.e., 0.1-30Hz. The pre-amplification stage followed another instrumentation amplifier with the adjusta- ble gain maintained between 0-500. Further, suppression of the low frequency components was done by implementation of
10Hz low pass filter. Since, all the circuitry used DC sources
and the frequencies above the 10Hz were rejected so the role of ambient noises due to 50Hz power line interference was neglected. The analog output available was digitized by using analog-to-digital converter IC ADC0804 and its output was provided to the input of the encoder IC HT640. The parallel digitized data was hence converted to serial data and feed to the ASK Transmitter module TX 01 433MHz. The ASK Receiv-
can be involuntary blink having amplitude around 50mV or a voluntary forced blink with amplitude of 500mV approximately [8]. The experimental tasks involved the execution of various combinations of eye movements by each subject. The eye movement combinations used for the present study are as follows:
1. Continuous Right (R) and Left (L) eye movements
for 5sec.
2. Right (R) and Left (L) eye movements for 10sec followed by central eye-gaze or hold for 10sec
followed by Up (U) and Down (D) eye movements.
3. Continuous forced blinks and normal blinks.
4. Right (R) – Up (U) and Left (L) – Down (D)
diagonal eye movements each with 5sec hold.
The output of the EOG amplifier was feed into the NI USB
6008 DAQ card. The signals were then visualized on the com- puter screen after the creation of sub vi in the LabVIEW soft- ware. The screen shots of the images seen while the acquisi- tion of the EOG signals during the execution of different tasks
V1
Instrumentation
Amplifier
V2
R H1
Instrumentation
Amplifier
H2
Band pass filter
Band pass filter
Instrumentation
Amplifier
Instrumentation
Amplifier
Low pass filter
Low pass filter
Acquired EOG Signals
Fig 2. Methodology for design of EOG amplifier.
IJSER © 2012
International Journal of Scientific & Engineering Research,Volume 3, Issue 6, June-2012 3
ISSN 2229-5518
by a subject has been shown in the results.
IJSER lb)2012
htt p://www .'lser. ora
International Journal of Scientific & Engineering Research,Volume 3, Issue 6, June-2012 4
ISSN 2229-5518
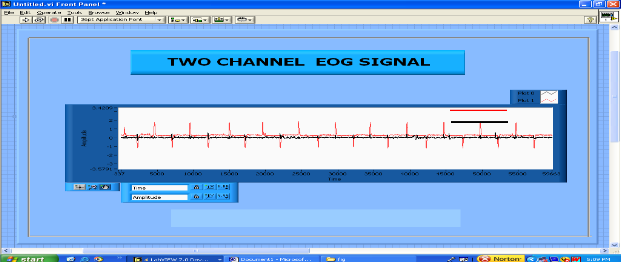
The red lines in the figures shows the signal acquired from the horizontal (H) channel and the black lines show the signal acquired from the vertical (V) channels. The Fig. 3 shows the R-L eye movements executed by the subject for 5sec. The phe- nomenon involved behind this resultant is that during the straight ahead eye-gaze, equilibrium is established in the eye dipole and EOG output is zero. While when the eye-gaze is shifted to right, the positive potential is picked up with respect to the second electrode and similarly, the reverse is resultant when the eye-gaze is shifted to left. The visualization of the acquired signals on the computer screen confirmed the occur- rence of well-defined EOG peaks.
The Fig. 4 shows the resultant when the subject executed R- L eye movements for 10sec followed by 10sec central eye-gaze followed by U-D eye movements for 10sec. It is evident from the observation that the U movements produces positive peaks while the D movements produces negative peaks.
The Fig. 5 which shows the continuous forced and normal
blinks clearly indicates that the two blinks are segregated due to production of positive potentials with different amplitude.
Horizontal Ch.
R R Vertical Ch.
L L
EOG_RIGHT_LEFT_5S
Fig 3. Continuous Right (R) and Left (L) eye movements for 5sec.
U R
D L
![]()
EOG_R,L(10S)_HOLD(10S),U,D(10S)
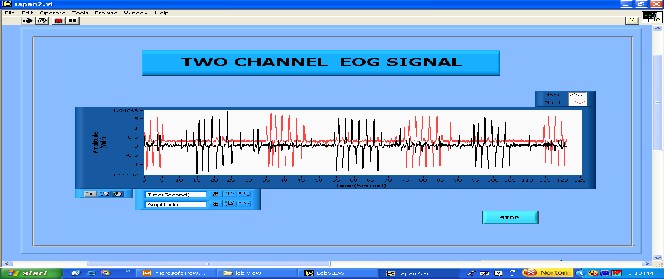
Fig 4. Methodology for design of EOG amplifier.
International Journal of Scientific & Engineering Research,Volume 3, Issue 6, June-2012 5
ISSN 2229-5518
FORCE BLINK
NORMAL BLINK
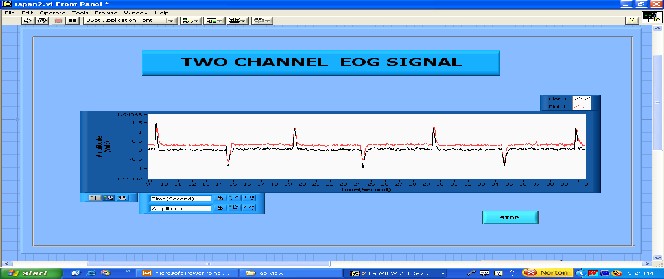
Fig 5. Continuous forced and normal blinks.
L/D
R/U
EOG_RIGHT UP(HOLD 5S)_LEFT DOWN(HOLD 5S)_DIAGONALLY
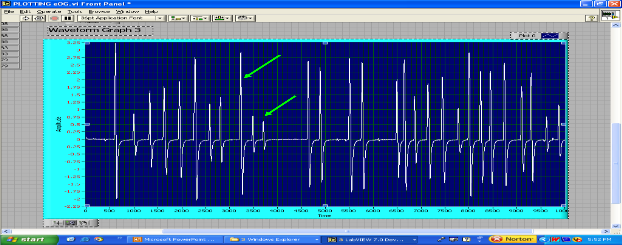
Fig 6. Right (R) – Up (U) and Left (L) – Down (D) diagonal eye movements each with 5sec hold.
±9V DC power supply). The wireless module further makes it
The Fig. 6 showing the R-U and L-D diagonal eye
movements each with 5sec hold shows the production of
another interesting result with different combination of eye
movements. This resultant demonstrates that even further combinations of eye movements could be made which could holds grounds for the development of intelligent assistive technology based upon implementation of classification algorithms on the EOG signals [8, 13, 14].
The purpose of the present study was to develop a cost effec- tive and accurate EOG amplifier. The novel part of this device is its processing speed, size and low power consumption (just
ideal for the real time implementation. More sophisticated
signal processing and parameter setting can further improve the accuracy, speed and usability. This system could be com- prehensively applied for the development of systems requir- ing real time EOG signals as primary input. Additionally the pivot research topology can be used as a model for the devel- opment of other biopotential amplifiers.
The authors would like to Mr. Rajesh Parashar, CBME, IITD
for his assistance during the hardware development.
IJSER © 2012
International Journal of Scientific & Engineering Research,Volume 3, Issue 6, June-2012 6
ISSN 2229-5518
[1] L. Young, “Methods and designs: survey of eyemovement recording methods,” Behav Res Methods Ins, vol. 7(5), pp. 397-429, 1975.
[2] H. Kasper and B. J. M. Hess, “Magnetic search coil system for linear detection of three-dimentional angular movements”, IEEE Trans Biomed Engg, vol 38(5), pp. 466-475, 1991.
[3] J. J. Gu, M. Meng, A. Cook, and M. G. Faulkner, “A Study of natural eye movement Detection and Ocular Implant movement control using processed EOG signals”, IEEE Procc Int Conf on Robotics and Automation, vol. 2, pp. 1555-1560, July 2003.
[4] A. Pinckers, M. H. M. Cuypers, and A. L. Aandekerk, “The EOG in Best's disease and dominant cystoid macular dystrophy (DCMD),” Ophthalmic Genetics, vol. 17(3), pp. 103-108, 1996.
[5] M. P. Espada, J. I. de Diego Sastre, and M. J. de Sarri{ Lucas, “EOG findings in patients with multiple sclerosis,” Acta Otorrinolaringol Esp, vol. 47(1), pp. 29-31, 1996
[6] R. Barea, L. Boquete, J.M. Rodríguez-Ascariz, S. Ortega, and E.
Lopez, “Sensory System for Implementing a Human—Computer
Interface Based on Electrooculography,” Sensors, vol. 11(1), pp. 310-
328, Dec 2010
[7] M. Hashimoto, K. Takahashi, and M. Shimada, “Wheelchair control using an EOG- and EMG-based gesture interface”, IEEE Proc. Advanced Intelligent Mechatronics, pp. 1212-1217, Sep 2009.
[8] T. Gandhi, M. Trikha, J. Santhosh, and S. Anand, “Development of an expert multitask gadget controlled by voluntary eye movements,” Expert Syst. with Applications, vol. 37, pp. 4204-4211, 2010.
[9] S. R. Choudhury, S. Venkataramanan, H. B. Nemade, and J. S.
Sahambi, “Design and Development of a Novel EOG Biopotential
Amplifier,” J Bioelectromagnatism, 2004.
[10] R. J. K. Jacob, “Eye movement-based human-computer interaction techniques: Toward non-command interfaces,” Human Computer Interaction Lab. Naval Research Lab. Washington, D.C.
[11] Y. H. Nam, Z. Halm, Y. J. Chee, and K. S. Park, “Development of sensing diagnosis system integrating digital telemetry for medicine,” Proc. 20th Annu. Znt. Conf. IEEE Eng. Med. Biol.Soc., vol. 20, pp. 1170–
1173, 1998.
[12] S. Kondra, C. Yew, F. Ahmed, and U. G. Hofmann, “Prototype of a patient monitoring device based on an embedded RISC/DSP system,” Proc. 39th Ann. Cong, German Society Biomed. Eng , Nuremberg, Sep 2005.
[13] R. Barea, L. Boquete, S. Ortega, E. Lopez, and J.M. Rodríguez- Ascariz, “EOG-based eye movements codification for human computer interaction”, Expert Syst. with Applications, vol. 39(3), pp.
2677-2683, Feb 2012.
[14] T. Gandhi, M. Trikha, J. Santhosh, and S. Anand, “VHDL based Electro Oculogram Signal Classification”, IEEE Proc. Int. Conf. Advanced Computing and Comm, pp. 153-158, Dec 2007.
IJSER © 2012