
International Journal of Scientific & Engineering Research Volume 2, Issue 11, November-2011 1
ISSN 2229-5518
A New Method to Secondary Caries Detection in
Restored Teeth
A.Sadeghi Qaramaleki, H.Hassanpour
caries diagnosis is 82% and minimum error rate is 18%.
Index Terms— Secondary caries, Dental radiography, Radiolucent area, Preprocessing, Gamma correction, Cumulative frequency diagram, Mach band
—————————— ——————————
N Dentistry science, to diagnose secondary caries in res- tored teeth which are not visible by eye, dental radiography images are used [1]. In these images secondary caries are seen as radiolucent areas. For example in fig.1 areas of A, B and C have caries and seen as radiolucent. In dental radiogra- phy images, besides caries there are other areas seen as radi- olucent which are not caries but related to the optical illusion that called Mach band effect [2]. So the dentist may have mis- take in diagnosing such caries and after opening the area sees that there is no caries and it has been mistaken by Mach band effect which in this case there would be some damage to the
teeth of patient [3].
Technical limitations in instrument used for image produc- tion, print or display cause them to impose nonlinear changes on image pixels which lead to reduce quality of image. That is, there is exponentiation of each gray level of pixels to a number
like ˠ. Moreover, since radiography instruments are not able to
display the exact color, depth and tissue of objects in images,
so the gamma applied on each pixel is not same in all points of
image. Therefore, adaptive gamma correction which has been
in recent papers [4], [5], by improving image quality, can help
dentist in interpreting the dental radiography images. In [6]
besides reviewing different methods of gamma correction in
digital images, there is a new method to improve image quali- ty based on local content of image (the context of different
areas). By performing this method on dental radiography im- ages, radiolucent areas of teeth becomes more apparent and it will be easier to diagnose secondary caries.
In this paper, after improving clarity of radiolucent areas in radiography image, the context of radiolucent area is analyzed
————————————————
Copmuter engineering and IT faculty, Iran, PH-04112895307. E-mail:
Copmuter engineering and IT faculty, Iran, PH-02733393580. E-mail:
h_hassanpour@yahoo.com
to diagnose secondary caries in restored teeth to understand that this radiolucent area is due to secondary caries or due to optical illusion. If radiolucent area gray levels exist on image, it means that there is caries otherwise is due to Mach band effect. If radiolucent area is due to caries, its effect will be reflected on histogram of image.
As mentioned previously, in this paper gamma correction is used to enhance image quality and to diagnose secondary ca- ries easier on dental radiography images. Based on power law, the luminance of a pixel with gray level of r in the image pro- duced by an instrument would be change as following [7] which is due to the limitations of instrument:
S = crˠ (1)
In (1), c and r are assumed as constant which depend on
imaging device and image display. Investigations indicate that
the position of objects to the imaging device (such as distance and angle of each part of object) effects on the value of ˠ. In
adaptive gamma correction methods, ˠ calculated for each area locally. So adaptive gamma correction methods such as [4],[5],[6] enhance image quality significantly.
In fig.2 there are two images which the first one is related to the original image and the second one shows the same image after enhancing by adaptive gamma correction method in [6]. As seen in fig. 2b, after applying this method on dental radio- graphy images, radiolucent areas related to caries area (A,B,C) are more apparent, while radiolucent area related to teeth with Mach band effect (D) reduced. So using adaptive gamma cor- rection has two characteristic:
IJSER © 2011
International Journal of Scientific & Engineering Research Volume 2, Issue 11, November-2011 2
ISSN 2229-5518
Fig.1. Radiography image with caries in the A, B and C in the radiolucent area
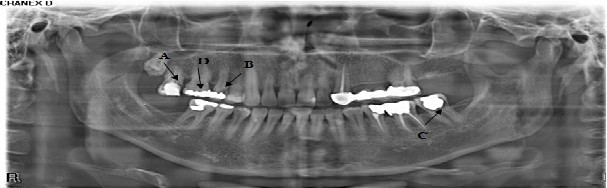
Fig.2.Effect of adaptive gamma correction on fig.1
Make the radiolucent area related to caries more apparent
Reducing Mach band effect
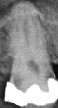
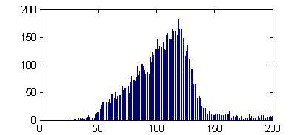
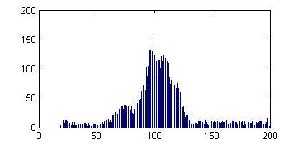
The caries on restored teeth are appeared as radiolucent areas around restored area. Because caries change the color of tooth, while there is no such a radiolucent area in teeth without ca- ries. So radiolucent area in the restored teeth is used to caries diagnosis. Since caries on enamel causes chemical changes on it, these changes are also reflected physically on radiography image (as radiolucent area). Our investigations indicate that these changes will be seen on the image histogram.
In the histogram of restored teeth without caries, there is
just one area on histogram whose peak related to the gray lev-
el of restored area. While histogram of restored teeth with ca-
ries has two areas which the area with little gray level is re-
lated to caries and the area with higher gray levels is related to
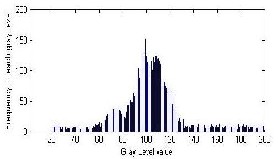
restored area which is seen on histograms in fig.3. These his- tograms are normalized form of the original histogram in
which the gray levels of background and whiteness of restored area are omitted, because they are same in all images and have no useful information. In fig.4 histogram of restored teeth of
fig.3 after gamma correction is shown. As seen in fig.4 after gamma correction, the histogram of teeth with secondary ca- ries is stretched but the histogram of teeth without caries is also remained. In the stretched histogram it is easy to select threshold to secondary caries diagnosis.
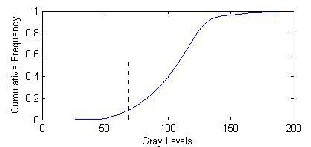
Looking carefully in histogram of fig.4, it can be said that the histogram of gray levels is an appropriate feature to caries diagnosis on teeth, because based on distribution of gray le- vels on histogram we can diagnose the carious teeth. But to automatic diagnosis and easier selection of threshold the his- togram transformed to cumulative diagram. By selecting a gray level as threshold and calculating the area under cumula- tive diagram before this threshold, it is possible to differentiate healthy teeth from caries one. In fig.5 cumulative diagram of histograms of fig.4 are shown. From fig.5 gray level 70 is se- lected as threshold, because the area under cumulative dia- gram before this threshold in carious teeth is smaller than teeth without caries.
IJSER © 2011
International Journal of Scientific & Engineering Research Volume 2, Issue 11, November-2011 3
ISSN 2229-5518

(a)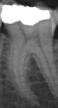
(b)
Fig.3. (a) Carious restored tooth and its histogram (b) Healthy restored teeth and its histogram
(a)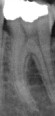
(b)
Fig.4. (a), (b) Histogram of fig.3a, fig.3b after gamma correction
IJSER © 2011
International Journal of Scientific & Engineering Research Volume 2, Issue 11, November-2011 4
ISSN 2229-5518
(a)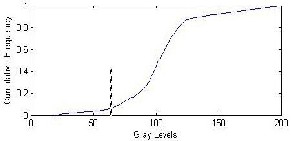
(b)
Fig.5. Cumulative diagrams of fig.4a, fig.4b
In this paper a new method to secondary caries diagnosis in dental radiography images is proposed. In this method, at first the clarity of radiolucent area in radiography image is in- creased and then teeth with secondary caries are diagnosed using cumulative histogram. Therefore the procedure of sec- ondary caries diagnosis is as following:
1. Preprocessing with gamma correction
2. Calculation of histogram
3. Normalization of the calculated histogram
4. Cumulative histogram calculation
5. Calculating area under cumulative diagram and ap-
plying selected threshold
To deliberate accuracy rate of proposed method in second- ary caries diagnosis in restored teeth, two criteria are used
which called GDR (Good Detection Rate) and FDR (False De- tection Rate). The GDR shows proposed method accuracy rate in secondary caries diagnosis and FDR shows error rate. The equations used are as following:
FDR = ![]() (2)
(2)
![]()
GDR= (3)
Parameters used in (2) and (3) are introduced in the follow- ing:
TP (True Positive): The number of carious teeth diag- nosed correctly
FN (False Negative): The number of healthy teeth di- agnosed with caries
FP (False Positive): The number of carious teeth diag-
nosed healthy
TN (True Negative): The number of healthy teeth di-
agnosed correctly
The proposed method has been applied on 100 restored
teeth images and the results without preprocessing are shown in Table 1 and results by applying gamma correction are shown in Table 2. By selecting gray level of 50 as threshold and 1% as area threshold, the proposed method has 82% accu-
racy rate in secondary caries diagnosis. By comparing Table1 and Table 2 seen that in the case of preprocessing the accuracy rate of diagnose is increased relative to the case without pre- process. Gamma correction process not only makes the radi- olucent area of teeth with caries apparent, but also reduces Mach band effect which can be seen by comparing area D in fig.2a, fig.2b.
IJSER © 2011
International Journal of Scientific & Engineering Research Volume 2, Issue 11, November-2011 5
ISSN 2229-5518
TABLE 1
GDR AND FDR IN CARIES DIAGNOSIS FOR DIFFERENT THRESHOLD WITHOUT PREPROCESSING
Gray level threshold | Area under diagram | TP (out of 26) | FP (out of 26) | TN (out of 74) | Accuracy rate (%) | Error rate (%) |
60 | 4 | 10 | 16 | 50 | 60 | 32 |
75 | 6 | 16 | 10 | 40 | 56 | 45 |
80 | 9 | 10 | 16 | 60 | 70 | 18 |
85 | 11 | 10 | 16 | 62 | 72 | 16 |
90 | 12 | 12 | 14 | 50 | 62 | 32 |
95 | 14 | 10 | 16 | 56 | 66 | 34 |
TABLE 2
GDR AND FDR IN CARIES DIAGNOSIS FOR DIFFERENT THRESHOLD WITH GAMMA CORRECTION
Gray level threshold | Area under diagram | TP (out of 26) | FP (out of 26) | TN (out of 74) | Accuracy rate (%) | Error rate (%) |
50 | 1 | 22 | 4 | 60 | 82 | 18 |
55 | 2 | 22 | 4 | 50 | 72 | 32 |
80 | 14 | 18 | 8 | 50 | 68 | 32 |
85 | 15 | 16 | 10 | 54 | 70 | 37 |
The author wishes give thanks to doctor Moudi for helping in the medical aspect of this research and doctor Hassanpour for helping in the engineering aspect of this research.
[1] S. Brent Dove , D.D.S and M.S, “Radiographic diagnosis of dental caries”,
Journal of Dental Education 2001; 65(10): 985
[2] R.H. Daffner, “Pseudofracture of the dens: Mach bands”, American Journal of
Roentgenol 1997; 128; 607-612
[3] H. Devlin, “Operative dentistry”, Springer-Verlag Berlin Heidelberg 2006
[4] I.Forosio , G.Ferrigno and A.Borghese, “Enhancing Digital Cephalic Radio- graphy With Mixture Models and Local Gamma Correction”, IEEE Transac- tions on Medical Imaging, Vol. 25, NO. 1, January 2006
[5] O. Sayadi and E. Fatemizadeh, “A Fast Algorithm for Enhancing Digital Cephalic Radiography Using Mixture Models and Local Gamma Correction based on the Gamma-map Contours”, ICBME, 2007, Tehran: Iran, pp. 76-84. [Persian]
[6] H.Hassanpour, S.Asadi,A.A.Pouyan, “Automatic Image Enhancement Based
on Local Gamma Correction”, CEIT ,2011, Hamedan: Iran. [Persian]
[7] R.C.Gonzalez and RE .Woods, “Digital image processing”.,2nd Edition
,Prentice-Hall 2002
IJSER © 2011