Fig.1 Gray Level co-occurrence matrix on LCLBP-OR: LCLBPCM approach.
(a) (b) (c) (d) (e)
Fig.3 Illustration of the Texton detection process: (a) 2×2 grid (b) Original image (c) & (d) Texton location and Texton types (e) Texton image.
Inte rnatio nal Jo urnal o f Sc ie ntific & Eng inee ring Re se arc h, Vo lume 3, Issue 2, February -2012 1
ISS N 2229-5518
A New Logical Compact LBP Co-Occurrence
Matrix for Texture Analysis
B. Sujatha, Dr.V.VijayaKumar, Dr.P. Harini
Abstract— Texture is an important spatial f eature, usef ul f or identifying objects or regions of interest in an image. Statistical and struc- tural approaches have extensively studied in the texture analysis and classif ication w hereas little w ork has reported to integrate them. One of the most popular statistical methods used to measure the textural inf ormation of images is the grey -level co-occurrence matrix (GLCM). The present paper combines the Logical Compact LBP w ith OR operator (LCLBP-OR), w hich is derived on textons, w ith GLCM approach and LCLBPCM using three stages. The LCLBP-OR reduces the texture unit size f rom 0 to 255 to 0 to 15 and achieves much better rotation
invariant classif ication than conventional LBP. The LCLBP-OR values are obtained by applying the logical OR operator in betw een relative positions of LBP w indow. To evaluate micro texture f eatures in stage one textons are evaluat ed. To make texture f eatures relatively inv a- riant w ith respect to changes in illumination and image rotation LCLBP-OR images are applied on LBP images of texton shapes in stage- tw o. Later in stage three the GLCM is constructed on LCLBP-OR and f irst and second order statistical f eatures are evaluated f or precise and accurate classif ication. The experimental results indicate the proposed LCLBPCM method classif ication perf o rmance is superior to that LBP, Gabor and other methods.
Keyw ords: Texton, LBP, First and Second order statistical f eatures, LCLBP-OR.
—————————— ——————————
Texture analysis is one of the most important techniques used in image processing and pattern recognition. In texture analy- sis, the first and most important task is to extract texture fea- tures which efficiently embody information about the textural characteristics of the original image. These features can then be used for the description or classification of different texture images. Many researchers have put forward various algo- rithms for texture analysis, such as the gray co-occurrence ma- trixes [1], Markov random field (MRF) model [2], simultan e- ous auto-regressive (SAR)model [3], Wold decomposition model [4], Gabor filtering [5,6] and wavelet decomposition [7,8] and so on.
Initially, texture analysis was based on the first order or
second order statistics of textures [1, 9, 10, 11]. In statistical approaches, textures are considered to be formed by certain random processes. The types of textures were analyzed by studying the statistical properties of the intensity values of pixels or the coefficients of certain filter banks. Haralick et al. [1] calculated second-order grayscale statistics using gray- level co-occurrence matrix (GLCM) and defined the statistical moments as a texture descriptor for which the correct classifi- cation rate of 60% to 70% was only reported in the literature.
However, the method is computationally inefficient. You
———— ——— ——— ——— ———
B.Sujatha, Assoc.prof, Research Scholar, GIET, Rajahm unry.
Dr. V.Vijayakumar, DEAN, Dept. of CSE & IT, Head SRRF, GIET, Ra-
jahmundry, A.P., India.
Dr.P. Harini, Professor & HOD, Department. of IT, St. Anns College of
Engineering and Technology,Chirala, A.P., India.
and Cohen extended Laws’ masks for rotation -invariant tex- ture characterization in their ―tuned‖ mask scheme [12]. In their experiments, a high accuracy rate was achieved. Howev- er, there are some limitations to many of the existing tech- niques for rotation-invariant texture classification.
In structural approaches, texture is considered to consist of
textural primitives, often called textons, which are located on
the texture with certain placement rules. Texton is a very us e- ful concept in texture analysis and has been utilized to devel- op efficient models in the context of texture recognition or object recognition [13, 14]. The texton co-occurrence matrices (TCM) proposed in [15] can describe the spatial correlation of textons for image retrieval. It has the discrimination power of color, texture and shape features. This paper put forward a new method of GLCM approach on LCLBP-OR for texture classification to describe image features. This method can ex- press the spatial correlation of textons. During the course of feature extracting, we have quantized the original images into
256 colors and computed color gradient from the RGB vector
space, and then calculated the statistical information of textons to describe image features.
The rest of this paper is organized as follows. The Section 2
describes the proposed method. Section 3, refers to the exp e- rimental evaluation and the classification results obtained. Section 4 concludes the paper.
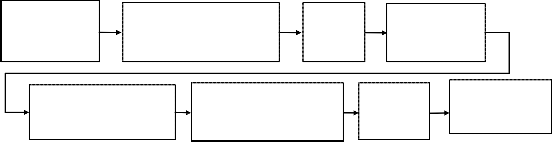
The proposed LCLBPCM approach on textons for effective texture analysis consists of five steps as shown in the block diagram of Fig.1.
IJSER © 2 012
Inte rnatio nal Jo urnal o f Sc ie ntific & Eng inee ring Re se arc h, Vo lume 3, Issue 2, February -2012 2
ISS N 2229-5518
Original Co- lour Image
Color to gray conversion using RGB quantization (Step-1)
Texton image (Step-2)
Local Binary Pattern (LBP) (Step-3)
Logical Compact LBP using logical OR (LCLBP-OR) ( Step-4)
LCLBPCM derivation and Feature Extraction (Step-5)
Classifier
Classified Tex- ture image
Fig.1 Gray Level co-occurrence matrix on LCLBP-OR: LCLBPCM approach.![]()
(a) (b) (c) (d) (e)
Fig.3 Illustration of the Texton detection process: (a) 2×2 grid (b) Original image (c) & (d) Texton location and Texton types (e) Texton image.
To convert color images into grey level image the present pa- per utilized RGB color quantization method. Color provides powerful information for texture classification and recognition even in the total absence of shape information. In order to ex- tract grey level features from color information the present paper utilized the RGB color space which quantizes the color space into 8-bins to obtain 256 grey levels. The index matrix of
256 color image is denoted as C(x, y). Let I(R), I(G), I(B) be the index value of unit vectors along the R, G and B axes of RGB color space, as follows:
C(x,y) = 32*I(R) + 4*I(G) + I(B)
(1)
several pixels, a coarse texture may result. If the textons in image are large and consists of a few texton categories, an ob- vious shape may result. If the textons are greatly expanded in one orientation, pre-attentive discrimination is somewhat re- duced. If the elongated elements are not jittered in orientation, the texton gradients at the texture boundaries are increased. To achieve this present paper utilized four texton types on a
2×2 grid as shown in Fig.2. In Fig.2 the four pixels of a 2×2
grid are denoted as V1, V2, V3 and V4. If two pixels are hig- hlighted in gray color of same value, the grid will form a tex-![]()
![]()
![]()
![]()
ton. The four texton types are denoted as T1, T2, T3 and T4 re- spectively as shown in Fig.2. The working mechanism of tex- ton detection is illustrated in Fig.3.
where
I(R)= 0, 0≤R≤32, I(R)= i, ((32*i)+1) ≤ R ≤ (32*(i+1))
i = [1, 2, 3, …,7] (2)
I(G)= 0, 0≤G≤32, I(G)= i, ((32*i)+1) ≤ G ≤ (32*(i+1))
i = [1, 2, 3, …,7] (3) I(B)= 0, 0≤B≤64, I(B)= i, ((64*i)+1) ≤ B ≤ (64*(i+1))
i =[1, 2, 3] (4)
Then each value of C(x, y) is 8 -bits binary code, ranging from 0
to 255 respectively.
In step two textons are defined which are having a close rela- tionship with image features and local distribution. Textons are considered as texture primitives which are located with certain placement rules. The textons are defined as a set of blobs or emergent patterns sharing a common property all over the image [16, 17]. The different textons may form vari- ous image features. If the textons in the image are small and the tonal difference between neighbouring textons is large, a fine texture may result. If the textons are larger and concise of
(a) (b) (c) (d) (e) Fig.2 Four special types of Textons: (a) 2×2 grid (b) T1 (c) T2 (d) T3 and (e) T4.
In step3 LBP is evaluated on the texton image for obta ining local information in a precise way. Local Binary Pattern (LBP) is based on the concept of texture primitives. This approach provides a theoretically, computationally simple and efficient methodology for texture analysis. To represent the formations of a textured image, the LBP approach, models 3×3 textons as illustrated in Fig.4. A 3×3 texton consists of a set of nine el e- ments, P = {pc, p0, p1, …, p7}, where pc represents the gray level value of the central pixel and pi (0≤i≤7) represent the gray level values of the peripheral pixels. Each texton then, can be ch a- racterized by a set of binary values bi (0 ≤ i ≤ 7) where
IJSER © 2 012
Inte rnatio nal Jo urn0al o f Sciepntific &0Eng inee ring Re se arc h, Vo lume 3, Issue 2, February -2012 3
ISS N 2229-5b518 i
1
and ∆pi = pi-pc.
pi 0
(5)
sults a value 7.
For each 3×3 texton a unique LBP code can be derived by
these binary values, as follows:
i 7
(1011)2
(0111)2
LBP bi
i 0
2i
(6)
(a) (b) (c ) (d)
Every pixel in an image generates an LBP code. A single
LBP code represents local micro texture information around a pixel by a single integer code LBP Є [0, 255].
Fig. 6 An example of evaluating LCLBP unit using relative position of LBP: a) a 3×3 LBP mask b) a 2×2 DCLBP mask c) Obtained Pattern d) Minimum 4 -bit valued pattern.
![]()
×
Fig. 4 Representation of LBP.![]()
LBP
Grey level co-occurrence matrices is constructed on LCLBP- OR. This matrix is named as LCLBPCM. The LCLBPCM will have grey levels ranging from 0 to 15, thus it will reduce com- putational cost. On LCLBPCM the first and second order sta-
In step-4 LCLBP-OR is applied on LBP image, which converts a 3×3 neighbourhood with a value that ranges from 0 to 15. The image classification is a data generalization process; a preprocessing that reduces the data variability to some extent should not seriously influence the classification accuracy. Ac-
tistical features are evaluated. The first order statistical fea-
tures are skewness and kurtosis as given in Eqs (8) and (9) whereas second order statistical features such as energy, en- tropy, contrast, local homogeneity, correlation, cluster shade and cluster prominence are calculated using Eqs (10) to (16) respectively.
L 1 3
cording to Narayanan et al. [18], reducing the data down to 4
zi m
* pzi
bits would still preserve more than 90 percent of the informa-
tion content. In LCLBP-OR, the logical OR operation is used
on relative position neighbours of LBP to compress 8 -bit bi-
Skewness
L1
i 0
σ 3
4
(8)
nary code into 4-bit binary code. The LCLBP-OR is different
from CLBP. CLBP is purely based on the principle of homoge-
zi
m
* pzi
(9)
neous neighbours where as LCLBP-OR is based on logical OR
of relative positions of LBP.
For each position (n1, n2 n3, n4) of LCLBP-OR the relative positioned values of the 3×3 LBP mask is chosen as shown in
Fig.5. From this, LCLBP-OR unit is evaluated as given in the Eqn. (7). The transformation process of LBP to LCLBP -OR is given in Fig 5. The Fig.6 illustrates an example of evaluating
Kurtosis
i 0
4
N 1
ln(Pij )Pij
Entropy= i , j 0
N 1
(10)
LCLBP-OR unit using relative position of LBP.
(Pij )
Energy= i , j 0
(11)

N 1
Contrast=i , j
Pij
(i j )2
(12)
0
N 1
Pij
![]()
2
![]()
![]()
![]()
(a) (b)
Fig.5 Transformation from LBP to LCLBP-OR: a) a 3×3 LBP
mask b) a 2×2 LCLBP-OR mask.
In order to reduce the complexity of computation and to
achieve rotation invariance the LCLBP-OR considered the minimum value pattern from the 4 bits. On the obtained
Local Homogeneity=
i , j 01 (i j )
(13)
minimum value patterns, weights are applied to achieve
N 1
Pij
(i )( j )

2
LCLBP unit, which is the minimum LCLBP-OR unit. For ex- ample in the Fig.6 the pattern 1011 is considered as 0111 and
Correlation=
i , j 0
(14)
weights are applied to obtain the LCLBP-OR unit, which re-
where P ij is the pixel value in position (i, j) in the texture im-
IJSER © 2 012
Inte rnatio nal Jo urnal o f Sc ie ntific & Eng inee ring Re se arc h, Vo lume 3, Issue 2, February -2012 4
ISS N 2229-5518
age and N is the Number of gray levels in the image
N 1
feature vector F2 contains second order statistics with seven features. Feature vector of each image is calculated from
N 1
iPij
i , j 0
is the texture image mean
LCLBPCM. In order to improve the classification gain the
combination of feature vectors F1 and F2 are also used as fea- ture vector F3.
The classification results are summarized in Table 1, where
Pij
2 i , j 0
(i )2
N
is the texture image variance.
3
each entry corresponds to the average correct classification rate of all the 84 image regions of different sizes. From the Ta- ble 1, it is observed that the mean success rate for feature vec-
tors F1, F2 and F3 are 92.66%, 87.14% and 95.81% respectively.
( i M x
Cluster Shade= i , j 1
N
( i M x
Cluster Prominance= i , j 1
N
iPij
j M y )
j M y )
N
jPij
Pij
Pij
(15)
(16)
Next, classification is carried out with Dataset-2 containing Google database, using the same combination of feature vec- tors F1, F2 and F3. The average classification rates for Dataset-2 are 92.09%, 86.33% and 94.82% for feature vectors F1, F2 and F3 which are shown in Table 2 respectively.
The proposed integrated method is compared with logical transform [21], SGLDM [1], Wavelet algorithm [22], Laws [21], and Gabor algorithms [23] and LCLBP-OR [24] approaches as shown in Table 3. Table 3 clearly indicates that the proposed
Mx = i , j 1
and My = i , j 1
LCLBPCM method outperforms the existing methods.![]()
In the classification phase, an unknown texture is used and its features are extracted and compared with the corresponding feature values stored in the features library using a distance vector formula given in Eqn. (17).![]()
n
Table 1: VisTex Database: Mean percentage of classification rate of each group of textures.
D(i)
abs[ f j ( x) f j (i)]
j 0
(17)
where n is the total number of features used, i = 1 to Q (Q is the number of images in the database), fj(x) represent the jth feature of unknown texture image (x) and fj(i) represents the jth feature of texture belonging to ith texture if the distance D(i) is minimum among all textures, available in the library. The success of classification is measured using the classification gain (G) and is calculated using Eqn. (18).![]()
Ccorr 100
Table 2: Google Database: Mean percentage of classification
Rate of each group of textures.
G(%)= M
(18)
where Ccorr is the number of sub-images correctly classified and M is the total number of sub -images, derived from each texture im- age.
The proposed method is experimented with Vis Tex [19] and Google [20] color image databases, each of size 512×512. For comparative analysis, texture classification is done using di f- ferent feature vectors for two different feature datasets. Data- set-1 and Dataset-2 contains 50 original color texture images each, every texture image is subdivided into 4 (256×256), 16 (128×128) and 64 (64×64) non -overlapping image regions, so that a total of 4200 (50×84) regions are obtained.
The classification is done for all 84 (4+16+64) sub-image re-
gions derived from each texture image in Dataset-1 and 2 us-
ing three different feature vectors (F1, F2 and F3). Feature vec- tor F1 contains the first order statistics with two features while
The present paper proposed an effective texture descriptor called LCLBPCM on texton images. The proposed approach has the advantage of discriminating power of the local struc- tural textons. The LCLBP-OR reduces the texture unit size from 0 to 255 to 0 to 15 and achieves much better rotation in- variant classification than conventional LBP. This makes the LCLBPCM as compact with gray levels ranging from 0 to 15![]()
Table 3: Comparison of Texture classification Methods.
Textured Name % Correct Classification (PCC) results
IJSER © 2 012
Inte rnatio nal Jo urnal o f Sc ie ntific & Eng inee ring Re se arc h, Vo lume 3, Issue 2, February -2012 5
ISS N 2229-5518
Brodatz Tex- tures with Tex- ture ID's | Logical Transform | SGLDM | Wavelet Algorithm | Laws | Gabor Al- gorithm | LCLBP- OR | Proposed LCLBPCM approach |
D94 | 93 | 67 | 63 | 52 | 62 | 93.75 | 93.98 |
D28 | 96 | 84 | 62 | 84 | 70 | 96.88 | 97.88 |
D90 | 88 | 64 | 62 | 47 | 67 | 97.50 | 97.96 |
D105 | 89 | 59 | 53 | 46 | 55 | 95.67 | 96.67 |
D28-1 | 99 | 67 | 65 | 77 | 63 | 89.13 | 89.78 |
D103 | 90 | 77 | 58 | 58 | 59 | 92.86 | 93.86 |
Average % of Classification | 93 | 70 | 61 | 61 | 63 | 94.30 | 95.02 |
and greatly reduces the computation time. The proposed me- thod is different from other methods because this method is having discrimination power of shape features by textons and invariant features with respect to change in illumination and image rotation by LCLBP-OR and overcomes the problem of sensitive to noise and captures important texture information by using LCLBPCM. The proposed method shows better clas- sification rate than the existing methods as shown in Table 3. It is found that the success rate is improved much by combining statistical and structural approaches.
The authors would like to express their gratitude to Sri K.V.V. Satyanarayana Raju, Chairman, and Sri K. Sasi Kiran Varma, Managing Director, Chaitanya group of Institu- tions for providing necessary Infrastructure. Authors would like to thank the anonymous reviewers for their valuable comments.
[1] J.S. Bridle, ―Probabilistic Interpretation of Feedforward Classification Network Outputs, with Relationships to Statistical Pattern Recognition,‖ Neurocomput- ing—Algorithms, Architectures and Applications, F. Fogelman-Soulie and J. He- rault, eds., NATO ASI Series F68, Berlin: Springer-Verlag, pp. 227-236, 1989. (Book style withpapertitle and editor)
[2] W.-K. Chen, Linear Networks and Systems. Belmont, Calif.: Wads- worth, pp. 123-135, 1993. (Book style)
[3] H. Poor, ―A Hypertext History of Multiuser Dimensions,‖ MUD
History, http://www.ccs.neu.edu/home/pb/mud-history.html.
1986. (URL link *include year)
[4] K. Elissa, ―An Overview of Decision Theory," unpublished. (Unplub- lished manuscript)
[5] R. Nicole, "The Last Word on Decision Theory," J. Computer Vision,
submitted for publication. (Pending publication)
[6] C. J. Kaufman, Rocky Mountain Research Laboratories, Boulder, Colo., personal communication, 1992. (Personal communication)
[7] D.S. Coming and O.G. Staadt, "Velocity-Aligned Discrete Oriented Polytopes for Dynamic Collision Detection," IEEE Trans. Visualization and Computer Graphics, vol. 14, no. 1, pp. 1-12, Jan/Feb 2008, doi:10.1109/TVCG.2007.70405 . (IEEE Transactions )
[8] S.P. Bingulac, ―On the Compatibility of Adaptive Controllers,‖ Proc.
Fourth Ann. Allerton Conf. Circuits and Systems Theory , pp. 8-16, 1994. (Conference proceedings)
[9] H. Goto, Y. Hasegawa, and M. Tanaka, ―Efficient Scheduling Focus-
ing on the Duality of MPL Representation,‖ Proc. IEEE Symp. Comp u-
tational Intelligence in Scheduling (SCIS ’07), pp. 57-64, Apr. 2007,
doi:10.1109/SCIS.2007.367670 . (Conference proceedings)
[10] J. Williams, ―Narrow-Band Analyzer,‖ PhD dissertation, Dept. of Elec- trical Eng., Harvard Univ., Cambridge, Mass., 1993. (Thesis or disserta- tion)
[11] E.E. Reber, R.L. Michell, and C.J. Carter, ―Oxygen Absorption in the
Earth’s Atmosphere,‖ Technical Report TR-0200 (420-46)-3, Aero- space Corp., Los Angeles, Calif., Nov. 1988. (Technical report with report number)
[12] L. Hubert and P. Arabie, ―Comparing Partitions,‖ J. Classification, vol.
2, no. 4, pp. 193-218, Apr. 1985. (Journal or magazine citation)
[13] R.J. Vidmar, ―On the Use of Atmospheric Plasmas as Electromagnetic Ref- lectors,‖ IEEE Trans. Plasma Science, vol. 21, no. 3, pp. 876-880, available at http://www.halcyon.com/pub/journals/21ps03-vidmar, Aug. 1992. (URL forTransaction, journal, ormagzine)
[14] J.M.P. Martinez, R.B. Llavori, M.J.A. Cabo, and T.B. Ped ersen, "Integrating Data Warehouses with Web Data: A Survey," IEEE Trans. Knowledge and Data Eng., preprint, 21 Dec. 2007, doi:10.1109/TKDE.2007.190746.(PrePrint)
[15] Guang-Hai Liu, Jing-Yu Yang, ―Image retrieval based on the texton co-
occurrence matrix,‖ PatternRecognition, vol.41, pp. 3521-3527, 2008.
[16] Julesz B., ―Textons, The Elements of Texture Perception, and their Interac-
tions,‖ Nature, vol.290 (5802): pp.91-97, 1981.
[17] Julesz B., ―Texton gradients: the textontheory revisited,‖ Biological Cybernet- ics, vol.54 pp.245–251, 1986.
[18] Narayanan R.M., T.S. Sankaravadivelu, and S.E. Reichenbach, ―Dependence of image information content on gray-scale resolution‖, Proceedings of IGARSS, 24–28 July, Honolulu, Hawaii, 1:153–155, 2000.
[19] VisTex.ColourImageDatabase
http:// www.whitemedia.mit.edu/vismod/imagery/VisionTexture. [20] Google database
[21] B. J. Falkowski and M. A. Perkowski, ―A family of all essential Radix addi- tion/subtraction multipolarity transforms: Algorithms and interpretations in Boolean domain,‖ in Proc. 23rd IEEE Int. Symp. Circuits Systems, New Or- leans, LA, May 1990, pp. 1596–1599.
[22] W. K. Pratt, Digital Image Processing. New York: Wiley, 1991.
[23] O. Pichler, A. Teuner, and B. J. Hosticka, ―A comparison of texture feature extraction using adaptive Gabor filtering, pyramidal and tree structured wavelet transforms,‖ Pattern Recognit., vol. 29, pp. 733–742, 1996.
[24] B. Sujatha, Dr.V.Vijayakumar, Dr.U.S.N.Raju, ―Integrated framework for
texture classificationusing statistical and structural approach‖, IJAEST, Vol.12,
issue 2, 2011.
IJSER © 2 012