International Journal of Scientific & Engineering Research, Volume 4, Issue 12, December-2013
ISSN 2229-5518
A Multi-Ink Color-Separation Algorithm
Maximizing Color Dependability
Sudhanshi Upadhyay1 , Tanmay Upadhyay2
1school of Computer science and Engineering,
VIT University , Vellore, INDIA.
e-mail: sudhanshi12@gmail.com
2NIT-Trichy , Production Engineering , Tiruchirappalli, INDIA. e-mail: ambitioustanmay@gmail.com
2227
Abstract
Present color-printing technologies may use three or more inks, e.g., CMY, CMYK, CMYKcm, CMYKGO, CMYKRGB. When the number of inks exceeds three, there is the usual color-management one-to-many mapping problem. Because the spectral properties of many modern inks are optimized for maximum color ranges and in some cases, black ink may not be used for pictorial images , many prints have poor color constancy. Changes in lighting considerably changes color balance, mainly for neutrals. An
pictorial images and using dye-based black inks with long- wavelength reflectance “tails” result in appreciable color inconstancy. As a consequence, in addition to color range expansion, color constancy should be an ink-design criterion.
In ICC-based color management, we are faced with the usual one-to-many mapping problem. There are usually more inks than colorimetric coordinates. As a consequence, many colors can be matched using more than one combination of inks. For multi-ink printing systems, the algorithms are difficult and may involve subdividing either
IJSER
algorithm was developed for multi-ink printing in which the
one-to-many mapping problem was overcome by selecting
ink combinations with the best color constancy between illuminants F11 and D50. The algorithm was tested using a pigmented-ink inkjet proofing printer. CMYKGO prints color-separated using these algorithms were compared with
a generic ICC profile for CMYKcm prints. The CMYK inks were common to both prints. The new algorithm enhanced
the color constancy considerably.
Introduction
Color constancy is a wide-ranging tendency of the color of an object to remain constant when the level and color of the illumination are changed. It is a result of both physiological and psychological compensations. Upon close assessment, color constancy occurs rather occasionally. The need for color-appearance models in an ICC color-management workflow is indirect verification that many imaging materials are not color constant.
The color constancy of neutrals has always been a design measure for photographic dyes since prints are viewed under many different lighting conditions. In graphic arts, color constancy, traditionally, was not of interest. Rather, metamerism was an issue and resulted in standardized viewing and illumination. Providentially, most traditionally-printed materials have reasonable color constancy because of the use of spectrally-flat carbon-based black inks and parting algorithms that maximize black ink for neutrals.
Because of the recognition of ink-jet printing technologies, unexpected color constancy is less commonplace. The practices of only using CMY for
colorimetric or colorant space to achieve greater
determinacy, instead, a separation strategy can be defined in which the choice of inks and their amounts could be based on maximizing color constancy. This was tested using a pigmented-ink inkjet printer with a CMYKGO ink set (C = cyan, M = magenta, Y = yellow, K = black, G = green, and
O = orange) and compared with a CMYKcm ink set (c =
light cyan and m = light magenta).
Algorithm Overview
The aim was to build a color look-up table (CLUT) that transformed CIELAB to CMYKGO color separations. First, we developed a supernatural printing model, a prerequisite in order to calculate an object’s color constancy. Using this model, we created a large number of virtual samples in six- ink space and calculated tristimulus values for various illuminants and a single standard observer. The sampling goal was to have a sufficient number of virtual samples such that in every region of the output’s color range, defined in CIELAB for D50, there were several color combinations. CIELAB was divided into coarsely-sampled cells and the samples were binned into these cells. For each cell, the most color-constant sample was selected. Non-uniform interpolation was used to populate a finer-sampled grid. To reduce processing time for CIELAB images, linear interpolation was used to create a fully populated 256 x 256 x 256 CLUT.
Spectral Printing Model
IJSER © 2013 http://www.ijser.org
International Journal of Scientific & Engineering Research, Volume 4, Issue 12, December-2013
ISSN 2229-5518
2228
Through experimentation, it became clear that to achieve the a*b* subspace for the slice of cells at L* from 40.0 to
sufficient accuracy for building color profiles, the cellular 46.7. extension12,13 was necessary. Thus, we needed 46 = 4096
nodes rather than the usual 26 = 64 for a six ink printer. However, because of maximum ink limitations for the
selected substrate, it was not possible to print all of them. An optimization based on research by Balasubramanian14 was used to statistically predict non-printable colors, find the optimal Yule-Nielsen n value, and create one- dimensional LUTs relating digital data with effective dot areas. Six hundred random colors were printed, measured spectrally, and compared with their model predictions. The mean and maximum color differences (D50, 2° observer)
were 0.96 and 3.86∆E00, respectively. The mean and
maximum RMS spectral errors were 0.8% and 4.5%,
respectively.
Virtual Sample Set
The goal was to create a dataset of ink amounts that well sampled CIELAB and whenever possible, resulted in different ink amounts with like colorimetry. As a proof of concept, a rather basic approach was used. Eleven steps from 0% to 100% area coverage in 10% intervals were defined for each ink. Using the spectral model, 116 =
1,771,561 virtual samples were created and CIELAB
coordinates calculated for D50 and the 2° observer.
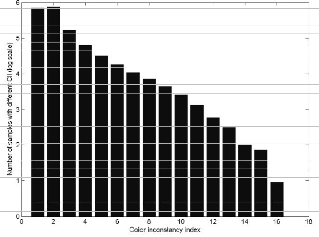
Figure 1. Color inconstancy index histogram of virtual sample set. Note logarithmic scale.
Color InIconstaJncy IndexSER
An index of color inconstancy was calculated, similar to
those described in references 1, 15, and 16: Tristimulus values were calculated for illuminants D50 and F11 from their predicted spectral reflectance. Using the CIECAT02
chromatic-adaptation transform, corresponding colors were calculated from each illuminant to D65. The corresponding-
color tristimulus values were transformed to CIELAB using D65 as the reference white. A biased CIE94 color difference was calculated with kL = kC = 2 between the pair of corresponding colors. In this manner, hue inconstancy was penalized twice as much as lightness or chroma inconstancy. This biased color difference defined the color-inconstancy index, CII.
A CII histogram of the virtual sample set is shown in Figure 1. Many ink combinations have appreciable color inconstancy. As a rule-of-thumb, samples with excellent color constancy have CII values below unity. The only way to change the CII statistics is to change the spectral properties of the inks. Unfortunately, the relationship between spectral properties and color constancy is very complex.
Sample Binning
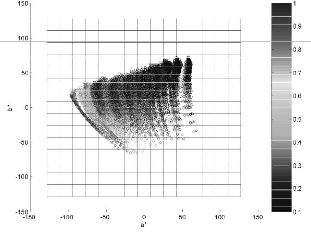
CIELAB space was divided into 16 x 16 x 16 cells and each sample was assigned to a cell based on its colorimetric values. As an illustration, Figure 2 shows the distribution in
Figure 2. Sample distribution in the a*b* subspace at L* between
40.0 and 46.7. The color of the datapoints indicates the amount of cyan ink.
Selection Criterion
In each cell, different samples signifying different ink combinations all achieved almost the same color. Criteria could be defined in addition to color constancy for instance spatial image quality and reproducibility. We restricted our criterion to color constancy. We selected the virtual sample within each cell with the smallest CII. A histogram of the selected samples is shown in Figure 3. Compared with Figure 1, the improvement in color constancy is observed.
IJSER © 2013 http://www.ijser.org
International Journal of Scientific & Engineering Research, Volume 4, Issue 12, December-2013
ISSN 2229-5518
2229
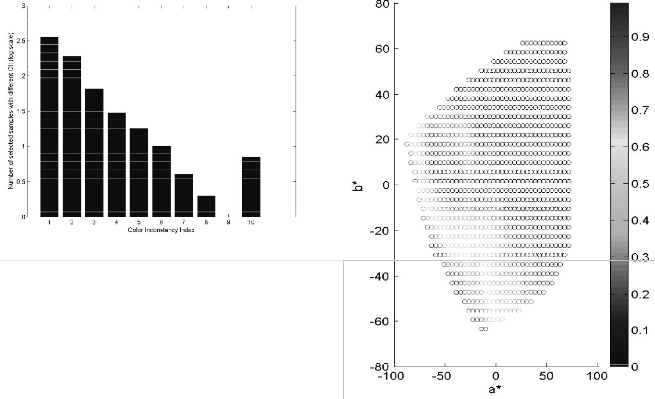
Figure 3. Color inconstancy index histogram of selected sample set. Note logarithmic scale.
Creating a CIELAB to CMYKGO 64 x 64 x 64
Lookup Table with Non-Uniform Interpolation
The selection course left us with a single sample in each cell but a non-regular distribution in CIELAB space. We used a three-dimensional-non-uniform interpolation algorithm for the area coverages in each color plane (CMYKGO) to create a regularly spaced 64 x 64 x 64 CLUT. To perform the interpolation we used the Matlab function, ‘griddata’ that
uses Delaunay triangulation.19, 20
The result is shown in Figure 4 for the cyan ink at L* =
40. For some regions of CIELAB, oscillations were observed in area coverage, seen in Figure 4 at 20b*. This
was likely caused by an inadequate number of samples in a
given cell. The oscillation will diminish with better sampling of the virtual sample set. It is also possible that some type of smoothing will still be necessary, for example, reference 9.
Color Gamut Mapping
Although the color gamut of our CMYKGO printer is notably larger than a typical CMYK printer, many supposed colors are still outside of the printable gamut. To fill the CLUT with area coverages for out-of-gamut colors, gamut mapping was essential. We selected the simple method of C*ab clipping maintaining hab and L* for colors within the L* range of the printer. Colors darker or lighter than the six- color gamut were mapped to the darkest and lightest neutral (a* = b* = 0). This is a type of ICC absolute color rendering. Certainly more elegant and elaborate algorithms have been published and it is well known that loci of constant hab do not have constant perceived hue.
Figure 4. Sample distribution following non-linear interpolationfor cyan ink at L* = 40,0. The color of the datapoints indicates the amount of cyan ink.
Creating a 256 x 256 x 256 Color Lookup
Table using Linear Interpolation
We extended the 64 x 64 x 64 CLUT to a fully populated
256 x 256 x 256 CLUT in order to advance processing speed when color-separating images encoded in the Adobe Photoshop CIELAB byte encoding scheme. For our implementation, not further optimized for speed, this
improved the processing time in Matlab from several hours
for a six-megapixel image to several minutes.
Results and Discussion
The spectral measurements of a GretagMacbeth ColorChecker Color Rendition Chart and a Kodak Gray Scale were used to create a CIELAB TIFF image for D50 and the 2° observer. The image was processed through the color-separation algorithm and printed on the CMYKGO inkjet printer. The image was also printed on an identical model printer with the standard CMYKcm ink set using the manufacturer’s generic ICC profile and ICC absolute colorimetric rendering. The CMYK ink set was common to both printers; the same glossy paper was also used.
CIEDE2000 color differences ( ∆ E00) between the
original targets and each printed reproduction were
calculated. The CMYKGO profile had much greater
IJSER © 2013 http://www.ijser.org
International Journal of Scientific & Engineering Research, Volume 4, Issue 12, December-2013
ISSN 2229-5518
2230
exactness (average ∆E00 = 1.5) than the generic CMYKcm profile (average ∆E00 = 7.3), as accepted. Our main research
goal was to produce a print with improved color constancy. This comparison is shown in Figure 5. For every color of the ColorChecker and gray scale, the CMYKGO separation using the planned algorithm achieved a higher level of color constancy than a classic profile. These results have been confirmed visually in a multi-illuminant light booth. In particular, the gray scale maintained its neutral appearance when the lighting was switched between 7500 K filtered tungsten, F2, F11, and 2200 K tungsten.
Table I. Color inconstancy indices between illuminants F11 and D50 for the 1931 standard observer for the listed samples.
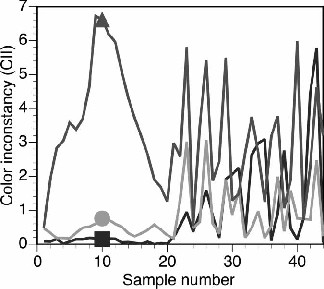
Figure 5. Color inconstancIy compJarison betweenSoriginal target
(filled square) and reproduction by CMYKcm (filled triangle) and
CMYKGO (filled circle) printers. Samples 1 – 20 correspond to the
Kodak Gray Scale; samples 21 – 44, the ColorChecker.
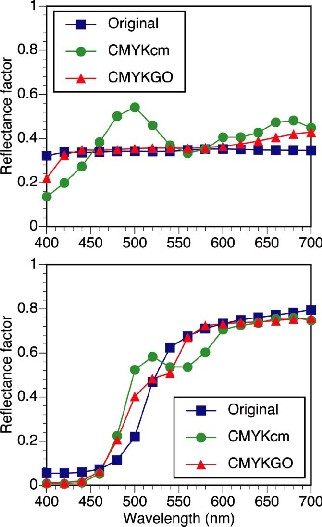
The reflectance spectra from the Kodak Gray Scale #5 and the Orange Yellow Color Checker samples are plotted in Figure 6. Their CII values are listed in Table I. For the neutrals, it is clear that the most spectrally flat sample had the best color constancy. In fact, only object colors with these properties have guaranteed color constancy. The CMYKcm profile did not use black, hence the large spectral selectivity and meagre color constancy. When analyzing the Orange Yellow, predicting which sample has the best color constancy based on spectra is not as straightforward. The more compound spectrum of the CMKYGO sample had better color constancy than the original ColorChecker sample. As shown by Berns, et al., the location of the absorption peaks may be the key factor rather than their degree of spectral selectivity. despite of the underlying cause, it is clear that the CMYKGO print had enhanced color constancy compared with both the CMYKcm print and many of the chromatic samples of the ColorChecker.
ER
Figure 6. Reflectance spectra of original and printed reproductions using CMYKGO and CMYKcm ink sets for Kodak Gray Scale Sample 5 (top) and Orange Yellow ColorChecker sample (bottom).
Conclusions
An algorithm was developed to deal with the one-to-many mapping problem when building color lookup tables for multi-ink printing. The unique feature of the algorithm is that maximal color dependability was the main selection
IJSER © 2013 http://www.ijser.org
International Journal of Scientific & Engineering Research, Volume 4, Issue 12, December-2013
ISSN 2229-5518
2231
criterion among ink combinations yielding similar color. The algorithm was tested with spectral data from numerous targets. The algorithm as implemented can be improved by a better CIELAB allotment of the virtual sample set. Furthermore, one can imagine a number of criteria that can be used as a selection metric, individually or combined, such as graininess, sharpness, maximum black ink amount, print precision, etc. Future research will focus on tradeoffs between these various criteria in terms of print quality. A theoretical analysis is also justified to understand the inter- relationships between the number of inks, their spectral properties, color constancy, and color gamut.
References
[1] V. A. Bardadym, “ Computer-Aided School and University
Timetabling: The New Wave,” in the Practice and Theory of
Automated Timetabling: Selected Papers from the 1st International Conference (Lecture Notes in Computer Science 1153), E. Burke and P. Ross, Eds. Berlin, Germany: Springer-Verlag , pp. 22–
45,1996.
[2] Burairah Hussin, Abd Samad Hasan Basari, and et.al , “Exam Timetabling using graph colouring approach”, 2011 IEEE Conference on Open Systems (ICOS2011),pp. 133-138, 2011.
[3] Gend Lal Prajapati1, Amit Mittal, “An Efficient Colouring of
Graphs Using Less Number of Colours”, IEEE , pp. 666-669 ,
2012.
[4] D. Werra de, “The combinatorics of timetabling,” European
Journal of Operational Research, 96 (3) pp. 504 –513, 1997.
[8] Amit Mittal, Parash Jain, Srushti Mathur, Preksha Bhatt,
“Graph Colouring with Minimun Colours” , 2011 International
Conference on Communication Systems and Network
Technologies , pp. 638-641 , 2011.
[9] Hertz, A. and D. de Werra (1987). Using tabu search techniques for graph coloring. Computing 39(4), 345-351.
[10] Br′elaz, D. (1979). New methods to color vertices of a graph. Communications of the ACM 22, 251-256.
[11] Turner, J. S. (1988). Almost all k-colorable graphs are easy to
color. Journal of Algorithms 9(1), pp. 63-82.
[12] Johnson, D. S., C. R. Aragon, L. A. McGeoch, and C. Schevon (1991, May-June). Optimization by simulated annealing: An experimental evaluation; part II, graph coloring and number partitioning. Operational Research 39(3), pp. 378-406.
[13] Kauther Drira, Lyes Dekar, Hemamache Kheddouci, “A Self- Stabilizing (delta+1)- Edge-Coloring Algorithm of Arbitrary Graphs”, International Conference on Parallel and Distributed Computing, Applications and Technologies, PDCAT, pp. 312-
317, 2009.
[14] R. Qu, E. K. Burke, B. McCollum, L. T. G. Merlot, and S. Y. Lee, "A Survey of Search Methodologies and Automated
Approaches for Examination Timetabling," The University of
Nottingham, Nottingham 2006.
[15] R. Lewis, "Metaheuristics for University Course Timetabling," School of Computing. vo!. PhD thesis Edinburgh: Napier University, 2006.
[16] A. Hertz and D. de Werra, “Using tabu search techniques for
graph colouring,” Computing 39 (4), pp. 345–351, 1987.
[17] J. Randall-Brown, “Chromatic scheduling and the chromatic
number problems,” Management Science 19(4), Part l, pp. 456 -
463, 1972.
IJSER
[5] P. Cheeseman, B. Kenefsky, and W. Taylor, Where the really
hard problems are, In J. Mylopoulos and R. Reiter (Eds.), Proceedings of 12th International Joint Conference on AI (IJCAI-
91), Volume 1, pp. 331–337., 1991.
[6] D. Brelaz, “New methods to colour vertices of a graph,”
Communications of the ACM 22, pp. 251 –256, 1979.
[7] P. Galinier and J-K. Hao, “Hybrid evolutionary algorithms for
graph colouring,” Journal of Combinatorics, 3(4), pp. 379 –397,
1999.
[18] N. Robertson, D. Sanders, P. Seymour and R.Thomas,"The
four color theorem", Journal of Combinatorial Theory Series B 70:
2–44, 1997.
[19] M. Stone, "Color in Information Display," in Vis06, 2006. [20] H. Asmuni, E. K. Burke, and 1. M. Garibaldi, "Fuzzy Multiple Heuristic Ordering for Course Timetabling." Proc of the
5th UK Workshop on Comput Intel , pp. 302-309,2005.
IJSER © 2013 http://www.ijser.org