International Journal of Scientific & Engineering Research, Volume 3, Issue 11, November-2012 1
ISSN 2229-5518
A Modified Model for Automatic Generation
Control in Deregulated Power Systems
K. HARI KRISHNA DR. K. CHANDRA SEKHAR
Abstract—This paper presents a new simplified AGC model for deregulated power systems. New AGC model facilitates us to design the controller with- out considering bilateral contracts. And also concentrates only the load disturbances not on the contracted loads. New AGC in deregulated power sys- tem is modeled by modifying conventional model with inclusion of bilateral contracts. Bilateral contracts will allow DISCOs in one area to get power from another area. This inclusion complicates the design of the controller by adding the contracted power also along with the dist urbance power. The pro- posed new AGC model is simulated in MATLAB environment and results were presented.
Index Terms — Automatic Generation Control, Bilateral Contracts, Power Systen Control, Deregulation.
—————————— ——————————
In the traditional power systems, the generation, transmission and distribution are owned by a single
entity called a vertically integrated utility (VIU), which supplies power at regulated rates. Such VIUs are interconnected by tie lines to other VIU’s to enhance reliability. Following a load disturbance within a VIU, the frequency of that VIU experiences a transient change, and the feedback mechanism comes into play and generates an appropriate rise/lower signal to the turbine to make the generation follow the load. In steady state, the generation is matches with the load, driving the tie line power and frequency deviations to zero.
In the restructured power systems, the VIU no longer exists. However, the common operational objectives, i.e. restoring the frequency and the net interchanges to their desired values for each control area remain. In the vertically integrated power system structure, some generation units are equipped with secondary control and frequency regulation requirements, but in an open energy market, even such GENCOs may or may not participate in the AGC. Deregulated power systems consists of generation companies (GENCO), distribution companies (DISCO), transmission companies and Independent System Operator (ISO). In this open market based in bilateral contracts, DISCOs have the freedom to contract with any of the GENCO in the own area or other area and these contracts are made under supervision of ISO. ISO is also responsible for managing the ancillary services like AGC etc. Same as DISCOs, ISO will also have freedom to get power from the same or other area to provide ancillary services to the system. Therefore, in system with an open access policy, there is a need for an AGC model which can be used for analysis as well as development of a efficient control strategies. Attempts have been made in recent past to study AGC issues in deregulated environment. Most of the studies essentially use a model proposed by M.A.Pai [1] for AGC in deregulated power systems.
The aim of this paper is to propose a simplified model of AGC in deregulated power systems which consider only disturbance power instead of considering the frequency deviation due to the bilateral contracts. This paper is organized as follows, In section 2 we first briefly present the AGC model proposed in [1] and which is used by several other researchers. We highlight its limitations and indicate the desirable features that an AGC model for the deregulated environment should possess. In the section 3 and 4 we proposed a new model which incorporates these features. Simulation results are given in section 5, to highlight the difference between the proposed model and existing AGC models. We also demonstrate design of a simple control strategy which can be adopted in the deregulation scenario. However this control is available for any of the well known alternate control strategies.
The conventional model, that’s being used by several researchers [….] is essentially a simple extinction of traditional Elgerd model [1]. In this AGC model, the concept of disco participation matrix (DPM) is includ- ed to the conventional AGC model to incorporate the bilateral load contracts. The DPM gives the extent of consumption of a DISCO from a particulate GENCO. In a power system with m DISCOs and n GENCOs, the DPM is given as
IJSER © 2012
International Journal of Scientific & Engineering Research, Volume 3, Issue 11, November-2012 2
ISSN 2229-5518
cpf11
cpf12
cpf13
cpf14
As indicated earlier, the introduction of DPM into the
DPM cpf21
cpf31
cpf22
cpf32
cpf23
cpf33
cpf24
cpf34
conventional AGC model is the most significant change that has been incorporated in the above mod-
el. The other features are the requirement that there
cpf41
cpf42
cpf43
cpf44
must be atleast one GENCO in each area to provide
AGC, making Bilateral Contracts are included in the
![]() is the “generation participation factor”, which
is the “generation participation factor”, which
shows the participation factor of GENCO i in the load![]()
following of DISCO j. The sum of all the entries in a column in this matrix is unity (
). Whenever a load demanded by a DISCO changes, it
is reflected as a local load in the area to which this
DISCO belongs.
These information signals which are not present in the conventional AGC. In [1] introduction of these signals are justified arguing that these signals give an indication
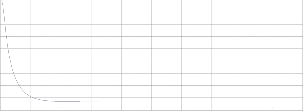
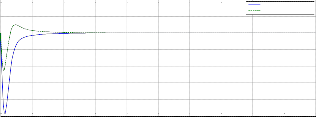
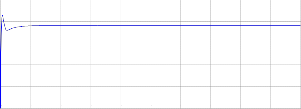
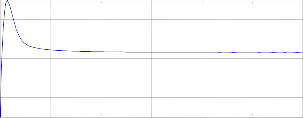
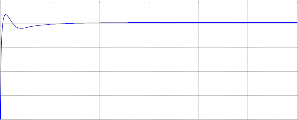
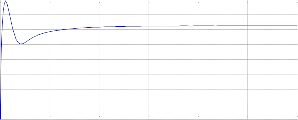
AGC model by use of DPM and different controllers have been designed for this model. But the fact is that the Bilateral Contracts are the known demands and design of controllers including bilateral contracts. Simulation results for the existing model which in- cludes bilateral contracts are presented with and without controller in the figure2. From figure2 it is evident that the performance of the system with and without the controller is same in all possible cases.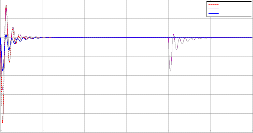
0.2
regarding which generator has to follow to which DISCO. This expectation is not valid in a deregulated environment.
As there are many GENCOs in each area, AGC signal has to be distributed among them according to their participation in the AGC. “ACE (Area Control Error) participation factors (apf)” are the coefficient factors which distributes the ACE among GENCOs. If there are
‘m’ number of GENCOs then![]() . The
. The
block diagram for two area AGC in a deregulated system is shown in figure1.In this model, the scheduled value of steady state tie line power is given as
P12,scheduled (demand of DISCOs in area II from GENCOs in area I) -
(demand of DISCOs in area I from GENCOs in area II)
P
Then the tie line power error 12,error is expressed as
P12,error P12,actual P12, scheduled
0.1
0
-0.1
-0.2
-0.3
-0.4
-0.5
0
-0.01
-0.02
-0.03
-0.04
-0.05
-0.06
-0.07
dist + cont at begi
cont+dist after delay only dist at begi
0 10 20 30 40 50 60
(a)
Only dist
Dist + Contr at Begi
Dist + contr with delay
P12,error
is used to generate the respective ACE
-0.08
-0.09
-0.1
0 10 20 30 40 50 60
signals as in traditional model. ACE of ith area will be
given as
ACE1 B1F1 P12tie,error
ACE2 B2F2 P12tie,error
Where n is the number of neighbor areas.
(b)
Figure2. Frequency response and Tie line power deviation for the existing model which includes bilateral contracts with and without controllers.
IJSER © 2012
International Journal of Scientific & Engineering Research Volume 3, Issue 10, October-2012
ISSN 2229-5518
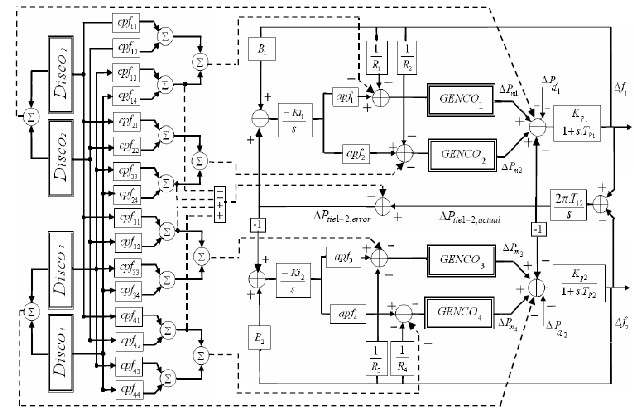
Figure 1.Two area AGC model in deregulated power system
KP1
KP1
0 0
![]()
![]()
![]()
1 0
TP1
![]()
KP1
TP1
![]()
KP1
TP1
0 0 0 0 0 0
![]()
KP1
TP1
![]()
KP1
TP1
![]()
TP1 KP 2
![]()
KP 2
0 0 0
TP 2
TP 2
0 1
0 0 KP 2
KP 2
0 0 0 0
KP 2
TP1
0 0
0 0
![]()
![]()
![]()
![]()
TP 2
TP 2
TP 2
TP 2
KP 2
0 0 1
0 0 0 0 0 0 0 0
![]()
0
0 0 0 0
![]()
TP
TT 1
2
0 0 0 0
1
![]()
0 0 0
0 0 0 0 0 0 0
0 0
TT 2
apf
0 0 0 0 0 0
1
cpf
cpf cpf
![]()
0 0 0 0
1 0 0 0 0 0 0 0
![]()
cpf 1 12 13 14
B T
0 0
1
TT 3
G1
T T
T T
A 0 0 0 0 0
![]()
1 0 0 0 0 0
apf
0 0
G1 G 2 G3 G 4
2 0
cpf cpf
cpf
cpf
TT 4
T
0 0
21 22 23
24
1 1
![]()
![]()
0 0 0 0 0
0 0 0 0
G 2
T T T T
![]()
apf
0 0
G 2 G 2 G 2 G 2
2R1TG1
TG1
0 3
cpf cpf cpf cpf
![]()
![]()
31 32 33 34
1
0 0 0 0 0 0 1
0 0 0
TG3
0 0
T T T T
2R2TG 2
TG 2
apf 0 0
G3
G3 G3
G3
4
cpf cpf cpf cpf
0 1
0 0 0 0 0 0
1 0 0
0
T 0 0
41 42 43 44
![]()
2R3TG 3
![]()
TG 3
G 4
![]()
![]()
![]()
T T T T
G 4
G 4 G 4
G 4
0 1
1 0
0 0
0 0 0 0
![]()
![]()
2R4TG 4
![]()
T12
![]()
T12
2
2
IJSER © 2012
International Journal of Scientific & Engineering Research Volume 3, Issue 10, October-2012
ISSN 2229-5518
J
T Qx
uT Ru
.dt f 2 f
2 P
2 .dt (8)
xa a a a
1 2 tie12
The two area AGC system considered has two individual are-
as connected with a tieline. The deviation in each area fre-
quency is determined by considering the dynamics of the gov-
ernors, turbines, generators and loads represents in that area.
Where Q and R are symmetric positive semi-definite, symmet- ric positive definite and control weightage matrices respective- ly. Then the solution of this control problem is given by
The tie line deviation between the areas is computed as the
u Ka xa
(9)
product of the tie line constant and the frequency deviation
Where the optimal feedback matrix Ka is defined as
difference between two areas. fig. 1 shows the AGC model of the two area system considered. The state space representation
1
Ka Ba P
(10)
of AGC model is given by![]()
x Ax Bu p q
(1)
Where P is the steady solution of the matrix “Reccati
equation”.
Where x is state vector, u is control vector and p is disturb-
A T P PA
PB R1
T P Q 0 (11)
a a a Ba
ance vector. A, B and Γ and β are the constant matrices associ-
ated with state, control, disturbance and bilateral contract vec-
tors respectively. In the state vector x, the secondary suffixes t,
ps and g indicates the states of the turbine, power system and
After finding the controller matrix Ka, the control law of the equation (13) is partitioned into its proportional and integral components as fallows
governor. The tie line power in two area AGC is given as
T
u Ka xa K p
K x
i
(12)
P 12 12 1 f2
(2)
tie f s
u K p x Ki
(13)
The scheduled power on the tie line in the direction from area
I to area II is
2 4 4 2
P12tie,scheduled cpfij PLj cpfij PLj
Where Kp and Ki are the proportional and integral feedback matrices respectively.
i 1
j 3
i 3
j 1
From the AGC model, frequency and tie line power error sig- nals are used to generate the ACE signal in respective area [1]. This ACE of the area is written as
Two area AGC model is used to illustrate the performance of the present model. To study this model, consider a case where
AC 1 B . 1 P
12 (3)
all the DISCOs contract with the GENCOs for power as per
E 1 f
tie
AC 2
2 .f2 P
21 (4)
the bellow DPM:
E B tie
0.5 0.25 0 0.3
In this paper we propose a PI state feedback controller for this system. A similar controller has been proposed in [9] and demonstrated only for thermal AGC model. Here, an outline of the controller is presented. Consider a v-dimensional out- put vector yc as
0.2 0.25 0 0
DPM
0 0.25 1 0.7
0.3 0.25 0 0
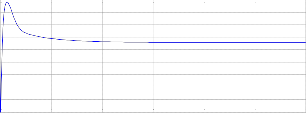
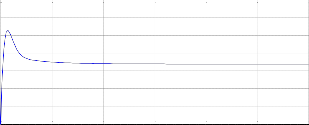
It is assumed that each DISCO demands 0.1pu MW power
yc Hx
(5)
from GENCOs as defined in DPM and each GENCO partici-
pated in AGC as defined by following apfs: apf1=0.75,
Consider the integral of yC as the state ρ of the integral con-
troller
apf2=0.25, apf3=0.5, apf4=0.5.
For the DPM mentioned above GENCOs generation must be
yc .dt Hx.dt
(6)
Pm1 0.105; Pm 2 0.045; Pm3 0.195; Pm 4 0.055.
Since the control strategy used in the paper is based on the integral of the ACE as a control signal. After combining equa- tions (1) and (6),we can write
Along with the contracted load, assume that the DISCO1 vio-
lates the contract and demands the excess power. This uncon-
tracted power must be supplied by the GENCOs in the same![]()
xa Aa xa Bau
Where
xa x ; Aa A
0 B
0 0
(7)
area. This must be reflected as a local load of the area but not
the contracted demand. The disturbance power is supplied by GENCOs in the area1 according to apfs. The response of the system is shown in figure 3.
The objective of this controller is achieved by minimizing a performance index (J). Where J is given as
IJSER © 2012
International Journal of Scientific & Engineering Research Volume 3, Issue 10, October-2012
ISSN 2229-5518
0.05
0
-0.05
-0.1
-0.15
-0.2
-0.25

Frequency deviation(rad/sec)
Frequency of Area1
Frequency of Area2
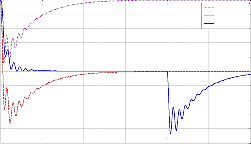
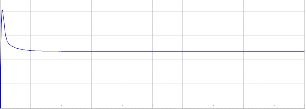
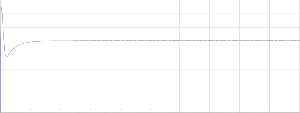
It may happen that a DISCO violates a contract by demanding more power than that specified in the contract. This excess power is not contracted out to any GENCO. This uncontracted power must be supplied by the GENCOs in the same area as the DISCO. It must be reflected as a local load of the area but not as the con-
-0.3
0 5 10
0
-0.005
-0.01
-0.015
-0.02
15 20 25 30
(a)Time
Tie-Line power
tract demand. Consider case 1 again with a modification that DISCO demands 0.1 pu MW of excess power. The response of the system is shown in figure 4 with this contract violation. The total local load in area 1
PL1,LOC LoadofDISCO1 LoadofDISCO2
-0.025
-0.03
-0.035
-0.04
-0.045
0 10 20 30 40 50 60 70 80 90 100
Time
=(0.1+0.1)+0.1 pu MW=0.3 pu MW Similarly, the total local load in area 2
PL 2,LOC LoadofDISCO3 LoadofDISCO4
=0.2 pu MW (no un contracted load)
0.18
0.16
0.14
0.12
0.1
0.08
0.06
0.04
0.02
Generated Power of GENCO1(puMw)
0.2
0.1
0
-0.1
-0.2
-0.3
-0.4
Frequency deviations (rad/sec).
Frequency of area 1
Frequency of area 2
0
0 5 10 15 20 25 30
Time
-0.5
0 5 10 15 20 25 30 35 40 45 50
Time
0.09
0.08
0.07
0.06
0.05
0.04
0.03
0.02
0.01
(c)
Generated Power of GENCO2(puMw)
0
-0.01
-0.02
-0.03
-0.04
-0.05
(a)
Tie line power (pu MW).
0
0 10 20 30 40 50 60 70 80 90 100
Time
(d)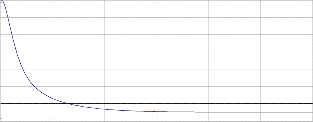
-0.06
-0.07
0 5 10 15 20 25 30
0.25
0.2
0.15
0.1
0.05
Generated Power of GENCO3(puMw)
0.35
0.3
0.25
0.2
0.15
Time
(b)
Generated power of GENCO1 (pu MW).
0
0 10 20 30 40 50 60 70 80 90 100
Time
Generated power of GENCO 4 (puMw)
0.1
0.05
0.08
0.07
0.06
0.05
0.04
0.03
0.02
0.01
0
0 5 10 15 20 25 30
Time
(c)
0
0 10 20 30 40 50 60 70 80 90 100
Time
(f)
Figure 3 (a) Frequency deviations (rad/s). (b) Tie line power.
(c,d,e,f) Generated power for case 1.
IJSER © 2012
International Journal of Scientific & Engineering Research Volume 3, Issue 10, October-2012
ISSN 2229-5518
0.12
0.1
0.08
0.06
0.04
0.02
0
Generated power of GENCO2 (pu MW).
[4] C. Fosha and O. I. Elgerd, “The megawatt-frequency control prob- lem: A newapproach via optimal control theory,” IEEE Trans. Power Apparatus & Systems, vol. PAS-89, no. 4, pp. 563–577, Apr. 1970.
[5] R. Christie and A. Bose, “Load-frequency control issues in power systems operations after deregulation,” IEEE Trans. Power Systems, vol. 11, pp. 1191–1200, Aug. 1996.
[6] E. Nobile, A. Bose, and K. Tomsovic, “Bilateral market for load following ancillary services,” in Proc. PES Summer Power Meeting, Seattle, WA, July 15–21, 2000.
[7] M. Ilic, F. Galiana, and L. Fink, Eds., Power Systems Restructuring: Engineering & Economics. Boston: Kluwer Academic Publishers,
0 5 10 15 20 25 30
Time
(d)
Generated power of GENCO3 (pu MW).
1998.
[8] G. B. Sheble, Computational Auction Mechanisms for Restructured
Power Industry Operation. Boston: Kluwer Academic Publishers,
1999.
0.25
0.2
0.15
0.1
0.05
0
0 5 10 15 20 25 30
Time
[9] R. D. Christie, B. F. Wollenberg, and I. Wangensteen, Transmission management in the deregulated environment,” Proc. IEEE Special Is- sue on The Technology of Power System Competition, vol. 88, no. 2, pp. 170–195, Feb. 2000.
[10] J. L.Willems, “Sensitivity analysis of the optimum performance of conventional load-frequency control,” Trans. Power Apparatus & Systems, vol. 93, no. 6, pp. 1287–1291, Sept./Oct. 1974.
[11] P. V. Kokotovic and R. Rutman, “Sensitivity of automatic control
systems (survey),” Automation and Remote Control, vol. 26, pp. 727–
749, 1965
(e)
0.08
0.07
0.06
0.05
0.04
0.03
0.02
0.01
0
Generated power of GENCO 4 (pu MW).

K. Hari Krishna received B.Tech. & M.Tech, de- grees in Electrical & Electronics Engg. from Ja- waharlal Nehru Technological University & Acharya Nagajuna University in 2003 & 2006 respectively. He is having 9 years of teaching ex- perience. Currently he is an Associate Professor in the Department of E.E.E., S.S.N. College of Engi- neering & Technology, Ongole. His teaching and
0 5 10 15 20 25 30
Time
(f)
Figure 4 (a) Frequency deviations (rad/s). (b) Tie line power
(puMW) (c) Generated power (puMW) for case 2.
AGC in deregulated power systems is modeled by modifying conventional model. Bilateral contracts will allow DISCOs in one area to get power from another area. The concept of DPM facili- tated the simulation of bilateral contracts. A new simplified AGC model in deregulated power systems has been proposed. Simula- tion results replicts that the new model is depicting the actual system even without bilateral contracts included in the controller design
[1] J. Kumar, K. Ng, and G. Sheble, “AGC simulator for price-based
operation: Part I,” IEEE Trans. Power Systems, vol. 12, no. 2, May
1997.
[2] “AGC simulator for price-based operation: Part II,” IEEE Trans.
Power Systems, vol. 12, no. 2, May 1997.
[3] O. I. Elgerd and C. Fosha, “Optimum megawatt-frequency control of multiarea electric energy systems,” IEEE Trans. Power Apparatus & Systems, vol. PAS-89, no. 4, pp. 556–563, Apr. 1970.
research interest include power system operation
and stability.
E-mail: pa_ha2002@yahoo.co.in

Dr. K. Chandra Sekhar received his B.Tech degree in Electrical & Electronics Engineering from V.R.Siddartha Engineering College, Vijayawada, India in 1991 and M.Tech with Electrical Ma- chines & Industrial Drives from Regional Engi- neering College, Warangal, India in 1994. He Received the PhD, degree from the J.N.T.U, Hy- derabad, India in 2008. He is having 17 years of teaching and research experience. He is currently Professor& Head in the Department of Electrical
& Electronics Engineering, R.V.R & J.C. College of Engineering Guntur, India. His Research interests are in the areas of Power Electronics, Industrial Drives & FACTS Controllers.
IJSER © 2012