International Journal of Scientific & Engineering Research, Volume 4, Issue 12, December-2013 7
ISSN 2229-5518
A Hybrid Neural Diagnostics Model for
Continuous Estimation of Reliability in Intricate
Engineering Systems
Abstract — The reliability of some sensitive engineering systems often derives from non-linear interactions at the sub system level. In practice, safety devices are usually implemented in such systems at the microscopic and macroscopic levels. This ensures robust availability and reliability. In addition, real time maintenance schemes are also deployed in high risk systems. Such policies are informed by real time instrumentation. On the whole, systems’ configuration and quality of maintenance decision determine reliability and availability. As a rule, such schemes are adaptive in nature. They acquire and process vital in service systems statistics for decision-making. In this regard, non-linear pattern classifiers and discriminant functions are emerging alternatives to conventional tools; especially when ability to acquire and use experience is at an advantage. Thus, using probability safety assessment approach; this work develops a feature extracting artificial neural network processor for continuous statistical monitoring and diagnosis of engineering systems. The aim is to support decision-making associated with system reliability and enhanced availability of high risk systems. In addition to ability to give piece wise description of the health status of the system, our neural diagnostic scheme predicts impending system down time more accurately when compared with the performance of a statistical monitoring tool.
Index Terms— hybrid scheme, neural computing, probability safety assessment, systems availability, systems reliability
—————————— ——————————
Fperformance, availability and reliability are specified over
Intelligent tools for fault detection and systems reliability
OR some engineering sIystemsJ, the criteriaSfor optimum ER
a very narrow bandwidth of systems parameters and op-
erating conditions. Occasionally, some of these systems fail catastrophically in service at very high financial and human cost. Thus, such systems are classified as intricate or high-risk systems. Structurally, they consist of complex multi-
component systems with high level of connectivity. Such net- works are often series and parallel coordination of compo- nents and subsystems. Thus, the efficiency and reliability of such systems derive from non-linear intra and inter subsystem interactions of components, its architecture, and the prevailing maintainability scheme. Fortunately, for most of these sys- tems, efficiency and state of health can be inferred from some measurable in-service statistics.
Therefore, for this class of engineering systems, automated instrumentation facilitates maintenance decision via online sensors and data processors. To date, many tools are available for this class of decision making. However, in approach; life testing techniques and probability safety assessment are two classical statistical methods for optimizing maintenance strat- egies. In a comparative analysis, [1] outlined the strengths and drawbacks of the some statistical processors. Though the review seems to have an appeal for probability safety assess- ment; the approach is still vulnerable to non-optimum inspec- tion frequency along with deficiencies in ability to characterize system non-linearity. In addition, apart from these shortcom- ings, it is evident that statistical inferencing machines do not incorporate real life experience. To address this problem [2], [3] and [4] proposed some intelligent tools for the assessment of systems reliability. These tools combine statistical infor- mation and experience to formulate real time maintenance policies for enhanced systems availability and reliability.
can be grouped as expert systems, qualitative automated rea-
soning or model based diagnosis. Others are the neural net- work and evolving distributed intelligence tools such as the web based or multi-agent framework. In contrast to traditional reliability assessment methods that are exclusively based on
signal processing and pattern classification techniques. These intelligent tools are able to follow experience, utilize complete domain of developed experts’ knowledge in the field and also exhibit ability to learn.
However, as obtained in traditional techniques, systems dynamics and non-linearity pose important challenge to intel- ligent fault diagnostics tool. Although the neural network has a proven advantage in ability to handle systems non-linearity; it is well-known that systems complexity and large data size elongates its training time to delay fault detection. Specifically, [5] described the limitation of artificial neural network in this regard. Based on this observation, [6] reiterated the needs for further development of the neural network scheme.
Consequently, this work presents the development of a hy- brid neural network and probability safety assessment scheme for continuous estimation of reliability in high risk systems. For a numerical example, we consider the energy sector as test case. Thus, our hybrid neural network and probability safety assessment algorithm is herein deployed to estimate system availability and reliability of two power barges belonging to a thermal station located at Egbin in southwest Nigeria.
Considering an n-component system in series or parallel con- nection with some wearing components at time instant (t). To
IJSER © 2013 http://www.ijser.org
International Journal of Scientific & Engineering Research, Volume 4, Issue 12, December-2013 8
ISSN 2229-5518
develop a probability boundary function for a neural network pattern classifier, we define the following probability vector of reliability measures at time t.
imizes equation (7) for all values of 𝑒, and 𝑡. Thus, this condi-
tion facilitates the characterization of the sequence of the tran-
sition matrices Φ(t) for various configurations of 𝑒(𝑡)
and 𝑃𝑡 (𝑡). Therefore, it is possible to approximate hierarchical
𝑡 𝑡 𝑡
𝑃𝑡 (𝑡) = (𝑃1 (𝑡)𝑃2 (𝑡) … 𝑃𝑛 (𝑡))
𝑡
(1)
values of 𝐻(𝑡, 𝑒) corresponding to various configurations of 𝑒(𝑡), Φ(t) and 𝑃𝑡 (𝑡).
⎧ 𝑚𝑖
𝑡 𝑃𝑃
![]()
� 𝑡 ; 𝑚𝑖 ≤ 𝑚𝑖
𝑚𝑗
⎪
⎪ 1; 𝑖
≤ 𝑚𝑖 ≤ 𝑚𝑖
(2)
Following the primary objective of this work, we propose a health index neural feature extraction scheme of the form;
𝑃𝑡 (𝑡) =
⎨
𝑘 𝑚𝑖
𝑃𝑖
𝑃𝑃
𝑡 𝑃𝑃
𝑡
𝑃𝑃
1 − � 𝑢
� 𝑃𝑖
𝑡 � ; 𝑚𝑖
≤ 𝑚𝑖 ≤ 𝑘𝑃 𝑚𝑖
⎪ 𝑚𝑖
⎪
𝑚𝑖
𝐻�𝚤 (𝑡, 𝑒) = 𝑊𝑒𝑡 + ∑𝑗=1 𝑊𝑒𝑗 𝕘�𝑒 (𝑡) 𝑒 = 1,2, , , 𝑛
(8)
⎩ 0; 𝑂𝑡ℎ𝑒𝑒𝑒𝑒𝑒𝑒
𝑡
𝑃𝑃
Equation (8) maps the health index at time 𝑡 into some state
vector
Here 𝑚𝑖 is the observed value of parameter i, 𝑚𝑖
𝑡
is the speci-
𝕘�𝑖 (𝑡) = (𝕘1 (𝑡), 𝕘2 (𝑡), … , 𝕘𝑛 (𝑡))
fied lower limit of the bandwidth of 𝑚𝑖
𝑃𝑃
if the system is at
(9)
peak operating condition. 𝑚𝑖
is the specified upper limit. 𝑘𝑃
The elements of the weight matrix 𝑊 are computed in the
is a factor describing the flexibility of the upper limit. Next, we
define 𝑒 = (𝑒1 𝑒2 … 𝑒𝑛 ) as the vector of available maintenance
strategies designed to transform measurable parameters of the
system to their peak operational values along a path that satis-
fies the performance index;
manner of [8] to extract the feature of the one-step health tran-
sition function Φ(t). Applying gradient techniques, and the
methods described in [9], it is easy to show that the feed for-
ward ANN process with backward propagation for the extrac-![]()
tion 𝑒𝑖𝑗 at time step 𝑘 (i.e. 𝑒𝑖𝑗 (𝑘)) using equations (6), (7) and
𝑡 IJS(3) ER
�𝑛�𝑃(𝑡) � = 〈𝑒(𝑡), 𝑐〉
Furthermore given 𝑒(𝑡), the transformation of the system’s
(8) can be written as;
𝐸�∆𝑒𝑖,𝑗 (𝑘)� = 𝜂𝐸 �∑𝑁 𝑒 (𝑘)𝕘 (𝑘)𝕘 (𝑘)� −
prevailing health status 𝐻(𝑡, 𝑒) is presumed to proceed via;
𝜂𝐸 �∑𝑁 𝑒
𝑘 𝕘
𝑘 𝕘 (𝑘) 𝑒
𝑁 𝑒𝑞 ,𝑃
𝑞,𝑗
𝑒(𝑡)Φ(t)𝑃𝑡 (𝑡)𝑇
= 𝐻(𝑡, 𝑒)
(4)
𝑝=1
𝑖,𝑝 (
) ( )
𝑝 𝑗
∑𝑞=1 ∑𝑡=1
(𝑘)𝕘𝑡 (𝑘)𝑒
(𝑘)�
Φ(t) is the non linear state transition matrix.
We also presume that in real systems, the dynamics of 𝑃𝑡 (𝑡)
is non-linear and stepwise in nature. Thus;
η > 0, is the learning rate.
In compact matrix form, equation (10) can be written as
(10)
𝑃�𝑡 (𝑡) = 𝑓[𝑃𝑡 (𝑡), Φ(t), 𝑒(𝑡), 𝑡] (5)
𝐸 �∆𝑤𝑖,𝑗(𝑘)� = 𝑊
(𝑘)𝐶 (𝑘) − ∑𝑁−1 �𝑊
(𝑘)𝐶 (𝑘)𝑊 𝑇 (𝑘)� −
![]()
This implies that the system transition matrix Φ(t) consists of 𝜂
𝑖∗
𝑇 (𝑘)𝑊𝑖 (𝑘)
𝑞=1
𝑖∗ 𝑞
sequence of transition operations on the conditional state
probability vector. Consequently;
𝑡 ∗ = 𝑃{𝑒|(𝑡, 𝑒), 𝑒} . 𝑃𝑡 ∗ {𝑒|𝑡∗ }
𝑊𝑖∗ (𝑘) 𝐶(𝑘)𝑊𝑖
where 𝐶(𝑘) = (𝕘
∗
𝑘 , 𝕘
𝑘 … 𝕘
𝑘 )
(11)
𝑃𝑖(𝑡,𝑦�)
(6)
( ) ( )
1 2
( )
𝑁−1
Here, 𝑃𝑡 ∗ {𝑒|𝑡 ∗ } is the conditional probability that the next ob-
𝑡 𝑡 ∗ ∗
The neurons in Equations (10) and (11) are activated by the
non linear strategic function
servation of 𝑃𝑖 (𝑡) will be 𝑃𝑖
(𝑡 ) given the instantaneous
health status of the system and the prevailing maintenance
policy 𝑒(𝑡) in the interval 𝑡 ∗ = (𝑡 + Δ𝑡).
𝕘𝑚 (𝑘) =
1![]()
(− ∑𝑘
𝑊𝑚 (𝑘))
(12)
Given that 𝕘𝑖 (𝑡) is the optimized cost of sustaining measured
parameter 𝑒 at a safe state 𝑚𝑡 , ∀𝑡. Assuming all transitions fol-
1 + exp
𝑚=0
low the shortest admissible trajectory. Then according to [7],
equations (3), (4) and (6) satisfy the following form of Bell-
man’s equation;
∗ ∗ ∗
To investigate the consistence and accuracy of the developed
feature extraction scheme, we follow the stability criterion derived in [10] from a Lyapunov stability analysis. With re- spect to equations (11) and (12) the condition for global as-
ymptotic stability of the feature extraction process is given as
𝕘�𝑖 (𝑡) = ∑𝑡 𝑃{𝑡|𝑒} min𝑑 𝐸𝑖 {𝑒(𝑡, 𝑡 ) + 𝕘𝑖 |𝑒, 𝑡, 𝑒}
(7)
2𝜂−‖𝐶(𝑘)‖2
(13)
In this work, 𝑒(𝑡, 𝑡 ∗ ) is a function of defective components in the interval between 𝑡 and 𝑡 ∗. Clearly, 𝑒(𝑡) is optimal if it min-
(‖𝑊(𝑘)𝑇 ‖2 + ‖𝑊(𝑘)−𝑇 ‖2 )2 ≤
![]()
‖𝐶(𝑘)−1 ‖2
IJSER © 2013 http://www.ijser.org
International Journal of Scientific & Engineering Research, Volume 4, Issue 12, December-2013 9
ISSN 2229-5518
Considering uniformly sampled data space, so that the data
acquisition interval Δ𝑡 is constant. Also, given the symmetry of
the hidden layers of our neural network architecture, it can be
easily verified that the choice of a symmetric positive definite
matrix 𝐶(𝑘) with 𝑀𝑀𝑀|𝐶(𝑒, 𝑗)| < 2𝜂 and the normalisation
𝑤𝑖,𝑗(𝑘)
corresponding probabilistic measures as expressed in equation
(2) are used as inputs to the neural feature extraction algo-
rithm, and the normalised weights 𝑒𝑖,𝑗 ⁄𝑒𝑗,1 are subsequently applied to compute 𝐻(𝑡, 𝑒).
𝑒𝑖,𝑗 (𝑘) =
𝑀𝑎𝑥�𝑤𝑖,𝑗(𝑘)�
![]()
in equation (11) guarantees stability in the
sense of equation (13).
To test our algorithm, we consider the problem of monitoring the health of two power barge systems belonging to an inde- pendent thermal plant operator in Nigeria. For this purpose, instrumentation parameters are sampled at a frequency of
0.01Hz on the test barges. On each of them, processing is de- centralized to the subsystems level. That is the subsystem with poorest condition determines systems’ overall health status. Some sensitive barge subsystems that are considered in this study include Turbine Support Legs TSLs, Main Transformer (MT), Lubrication System (LS), Water Cooling System (WCS), and Exhaust Gas System (EGS). At the time of this work, maintenance decisions on the facility are based on the Com-
puterized Maintenance Management Software (CMMS), this is
The parameters short listed for analysis on Power Barge A by the dimension reduction process include; TTXD3, TTXD5, TTXD17 and TTXSPL. Correspondingly, on Power Barge B, we have TTXD2, TTXD8, TTXD14 and TTXD17. For each of the Barges, 2300 recorded data points were used for network training. The convergence condition is satisfied after an aver- age of 5863 epochs. Training and validation were performed in Matlab R2008a environment on a 1.83GHz Intel iCore 3 pro- cessor. The maximum duration for training and validation recorded is 117seconds. Tables 1a and 1b show the extracted
weight vectors for connections linking the first/second (𝑘 = 2)
and the second/third second (𝑘 = 3) layers.
Table 1a: Weights Vectors between First and Second Hidden
Layers on Power Barges A and B
assisted by the specification of the safe bandwidths of the cor- responding acquired data. Specifically, these include tempera- ture, air filter pressure, frequency and amplitude of vibration e.t.c.
We adapt the neural computing network to extract the ele-
ments 𝑒𝑖,𝑗 of the transition matrix at discrete time state (𝑘).
Using Equation (2), the measured EGTs are transformed into
probability measures at the input nodes. To train the network,
corresponding availability measure at the output node is ob-
tained from the normalized CMMS assessment. Learning is
initiated with an order of magnitude analysis. On these test barges, the analysis converged on the EGTs as the instrumen- tation data of interest.
Probability measures corresponding to TTXD1, through
TTXD4 were admitted as inputs into each of the input nodes.
For all layers, learning starts with 𝑒𝑖,𝑗 = 𝑒𝑗,𝑖 = 0.025. These values are updated using equation (9) until �𝑒𝑖,𝑗 (𝑛 + 1) −
𝑒𝑖,𝑗 (𝑛)� < 𝑡𝑡𝑡 = 0.001 is satisfied. At the end of a training cy-
cle, the EGT measurement on any of the input nodes with
Table 1b: Weights Vectors between Second and Third Hidden
Layers on Power Barges A and B![]()
4 𝑚 𝑛 2 2
Individually, Tables 1a and 1b show the dependence of
𝑀𝑒𝑛
�∑𝑘=1 ∑𝑖=1 ∑𝑗=1��𝑤𝑖,𝑗+𝑤𝑗,𝑖 � �
𝑘
(10)
the 𝑒𝑖,𝑗 ’s on the current and past records of instrumentation
parameters. Along with equation (10), these tables and their
is replaced with the next available measurement. Here m and
n are the numbers of perceptrons in the 𝑘𝑡ℎ 𝑀𝑛𝑎 (𝑘 + 1)𝑡ℎ lay-
ers respectively. This dimension reduction cycle is repeated
until all the EGTs and TSs have been considered in the for-
ward and backward directions. Conversely, to deduce the health status of the Barges from the EGT measurements; the
complements for (𝑘 = 1) and (𝑘 = 4) facilitate a categoriza-
tion of the effectiveness of the instrumentation process, their
reach-ability on the state of the subsystem(s) and effect on the
overall performance of the EGS.
Figures 1 and 2 validate the performance of our hybrid neural
IJSER © 2013 http://www.ijser.org
International Journal of Scientific & Engineering Research, Volume 4, Issue 12, December-2013 10
ISSN 2229-5518
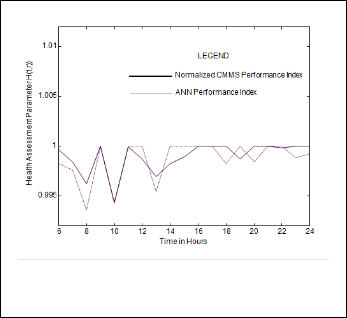
computing scheme using the outcome of the CMMS as benchmark. This comparative analysis was carried out for eighteen hours of a day that Barge B was shut down for cor- rective maintenance.
Fig.1. Comparative Analysis of Hybrid Neural Compu-
Levels
According to the classification on Table 2, subsystems with good performance conditions are continuously monitored. The CMMS recommends sequence of adaptive maintenance poli- cies for subsystems with tolerable performance index, whereas Barge with emergency state in any of its subsystems is shut down for corrective maintenance.
Compared with the CMMS output, the computational accura- cy of the hybrid neural computing scheme is evaluated as
99.72%. To obtain this efficiency, we have used the normalized CMMS performance index as training and validation data. Also, by using a neural network architecture that simulate system’s configuration at the component level, our hybrid neural diagnostics scheme has the advantage of enhanced trouble shooting when compared with the CMMS. To be pre- cise, the break down in Barge B as shown in Figure 2 was traced to a worn outlet valve relating to TTXD14. This is as indexed in the H(t,r) obtained by our hybrid neural computing scheme.
This work developed a hybrid neural computing scheme to
IJSER
ting Scheme and CMMS Assessment on Barge A
Fig.2. Comparative Analysis of Hybrid Neural Compu- ting Scheme and CMMS Assessment on Barge B
Summarily, three hierarchical levels of performance are speci- fied for the outcomes of H (t, r) as classified in Table 2.
GOOD PERFORMANCE | 0.995 ≤ H(t, r) ≤1.0 |
TOLERABLE PERFORMANCE | 0.995 ≤ H(t, r) ≤0.990 |
EMERGENCY CONDITION | H(t, r) < 0.990 |
Table 2: Hierarchical Classification of the EGS Performance
demonstrate that a combination of the traditional probability
safety assessment technique with an intelligent tool (precisely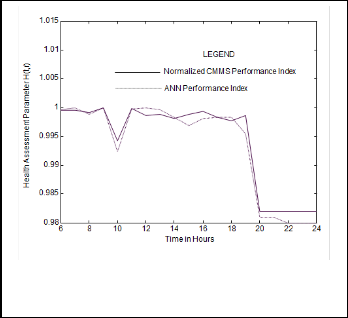
the artificial neural network) can significantly improve on the
precision and diagnostic ability of devices that are deployed
for continuous monitoring of intricate engineering systems. The hybrid scheme has inherent abilities to characterize the interplay between subsystems and components, reduce in- strumentation sample space and accelerate trouble shooting to enhance systems availability. This hybrid form has the ad- vantage of improved convergence rate of the neural compu- ting algorithm. However, for real time health monitoring of high risk engineering systems, the scheme should be devel- oped further to minimize the lag time between data acquisi- tion and health inference.
The authors are grateful to Mr. J. Adeyemo and the Manage- ment of AES Nigerian Barge Operation for supporting this work.
[1] Yang Y., and Klukte G., (2000) Lifetime Characteristics and Inspection Schemes for Levy Degradation Process. IEEE Transactions on Reliability. 49, 377-382.
[2] Hole K. and Netland L. H. (2010). Toward Risk Assess-
ment of Large-Impact and Rare Events. IEEE Security and
Privacy Vol. 8, pp. 21-27.
[3] Nokata M. and Tejima N.(2004). “A Safety Strategy for
Rehabilitation Robots”. Advances in Rehabilitation Robot- ics Springer-Verlag Berlin Heidelberg pp. 177 – 185.
IJSER © 2013 http://www.ijser.org
International Journal of Scientific & Engineering Research, Volume 4, Issue 12, December-2013 11
ISSN 2229-5518
[4] Wang L. and Singh C. (2008). Population –based Reliabil- ity Evaluation of generation Systems with Wind Power Generation. IEEE transaction on Power Systems, 23(3)
1336 - 1345
[5] Hermann N.(1995). On the Probabilistic Interpretation of
Neural Network Classifiers and Discriminative Training
Criteria. IEEE Transactions on Pattern Analysis and Ma- chine Intelligence., 7(2), 107-119.
[6] Kobbacy K. A.H. (2004). On the Evolution of an Intelligent Maintenance Optimization System. Journal of Operations Research Society., 55(2), 139-146.
[7] Bertsekas, D.P., Homer, M. L. Logan, D. A. Patek, S. D. and Sandell, N. R. (2000). Missile Defense Interceptor Al- location by Neuro-Dynamic Programming. IEEE Transac- tions on Systems, Man, and Cybernetics., A30(1), 42-51.
[8] Kolmogorov A. N. K. (1957). On the Representation of
Continuous Functions of many Variables by Superposi-
tion of Continuous Functions of One Variable and Addi- tion. Dokl. Akad. Nauk SSSR..,114, 953-956.
[9] Kil R. M.( 1993).Parameter Estimation of a Network with Kernel Functions of Bounds and Locality. In Science of Ar- tificial Neural Networks II, Proc. SPIE., 1966, 284-295.
[10] Yucel E. and Arik, S. (2012). New Sufficient Criteria for Global Robust Stability of Neural Networks with Multiple Time Delay. TWMS J. App. Eng. Math. Vol. 2, No. 1, pp. 1-18.
IJSER © 2013 http://www.ijser.org