The research paper published by IJSER journal is about A Discrete-event Coordinates Methodology For A Composite Curve 1
ISSN 2229-5518
A Discrete-Event Coordinates Methodology for
A Composite Curve
I. Akiije
ABSTRACT - This paper gives information about the results of investigation on a discrete -event simulation methodology to compute coordinates of a composite curve through Information and Communication Technology (ICT) system. Tangible modelling and simulation validity was done using general purpose application programs that is readily available rather than costly and tedious conventional hand method. In the methodology, deflection angle, tangential angles for the two transition curves and central circular arc, together with deviation angle computations, were successful modelled and simulated via ICT approach. Coordinates produced as the result of the process are useful set of numbers in Eastings and Northings to defining the entry transition curve, central circular arc and the exit transition curve of a highway or railroad composite curve at site. The conclusion in this study is that a discrete-event simulation is a suitable methodology for computing useful coordinates for setting out of a composite curve meant for a safe highway or railroad.
Index Terms – Coordinates, Composite, Discrete, Safe, Simulation, Tangential, Transition
1 INTRODUCTION
Discrete-event simulation could practically be done by hand calculations whereas for the amount of data that must be stored and manipulated for most real-world systems dictates that same is better done on a digital computer, Schriber and Brunner [1], Law and Kelton [2]. Discrete-event simulation goal in this paper is concerned with the modelling of a composite curve for highway or railroad in Information and Communication Technology (ICT) environment rather than traditional hand approach. According to Law and Kelton [2], discrete-event simulation concerns the modelling of a system by a representation in which the state variables change instantaneously at separate points. Simulation is a powerful tool for the evaluation and analysis of new system designs, modifications to existing systems and proposed changes to control systems and operating rules. Carson [3] claimed that conducting a valid simulation is both an art and a science. Adedimila and Akiije [4], Akiije [5], Akiije [6] considered simulation as the representation of physical systems and phenomena by computers, models and other equipment.
Simulation of coordinates for a composite curve by employing computer is the focus of this study. Coordinates
are ordered set of numbers which specified the position or orientation of a point or geometric configuration relative to a set of axes in Eastings and Northings as claimed by Akiije [7].

I. Akiije. Department of Civil and Environmental
Engineering, University of Lagos, e-mail: akiijeia@yahoo.com
According to Tiberius [8], McDonald [9], coordinates may be obtained from the record of some accurately located points of the framework of geodetic surveys or global positioning system (GPS).
Composite curve consists of entry transition curve, central circular arc and the exit transition curve. Types of transition curve in use for composite curve include clothoid or spiral, Bernoulli’s Leminscate, cubic parabola, cubical spiral and S.Shaped. The need for transition curve paves in where a vehicle travelling on a straight course enters a curve of finite radius. At this juncture, Andrzej [10] claimed that such vehicle will be subjected to a sudden centrifugal force that will cause shock and sway. In order to avoid this centrifugal force, it is customary to provide a transition curve at the beginning and at the end of a circular curve.
A transition curve has a radius equal to infinity at the end
of the straight and gradually reducing the radius to the radius
of the circular curve where the later begins. Incidentally, the transition portion is useful for building up the centrifugal force gradually. Also, it provides a more aesthetically pleasing alignment and gradual application of the superelevation. Superelevation is the desirable raising of one edge of a roadway or a rail higher than the other along curve of a road or railway. The reason is to counteract centrifugal forces on passengers and vehicles or trains. The action brings comfort and safety to passengers and also prevents vehicles from overturning or sliding off the highway.
The objectives of this paper therefore is to provide a desirable automation platform for highway engineers to define coordinates as set of numbers in Eastings and Northings that are useful in an electronics environment for the design of a composite curve. Significantly with this study knowledge, computation of any segment of the composite
IJSER © 2012 http://www.ijser.org
The research paper published by IJSER journal is about A Discrete-event Coordinates Methodology For A Composite Curve 2
ISSN 2229-5518
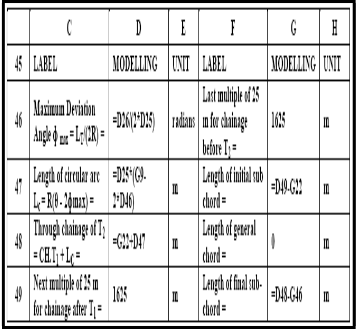
curve can be modelled in a particular module and be simulated. Also, this study can be appreciated for where local computation modification is to be made in the modelling module; it is always made at ease. At this facet, by selection of
angle m a x at the common tangent between the transition and
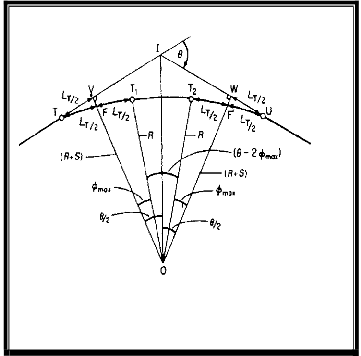
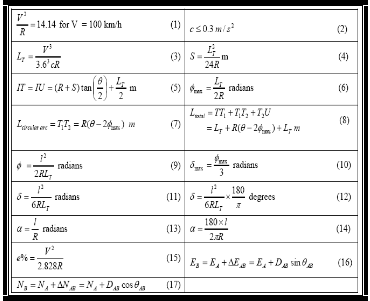
the circular curve is defined by Equation 6. The length of the circular arc T1T2 is defined by Equation 7. The total length of
an existing value and replacement of same by a new one, the
the composite curve Ltotal
is defined by Equation 8.
required results are generated automatically. This technique is a powerful tool for geometric modelling and simulation of a
composite curve coordinates. The justification for this study is that the use of digital computer is a most common computing device and a cheaper means of computation rather than conventional hand approach. In this study, digital computer performs operations on data represented in digital or number form with continuity and reusability capability for further necessary computation coordinates.
It is worthy of note that, the process of minimization and
elimination of errors caused by instrumental imperfections or human operation by manual approach is a tedious work in order to accurately determine coordinates of points of a composite curve. However, GPS receiver can locate points in coordinates to an accuracy of ± 0.02 m as claimed by Uren and Price [11]. Therefore it is a useful instrument for defining coordinates points developed by the discrete-event methodology for a composite curve. GPS consists of three segments called the space segment, control segment and user segment. The use of GPS is advanced in this study at user segment level to capture coordinates of field stations and intersection points as data to compute coordinates for chainage points to define composite curve at the highway site. Also, Microsoft Excel a general purpose application program has been used to generate necessary chainage points coordinates for composite curve through computation via simulation modelling in an electronics office.
2 CONCEPTUAL FRAMEWORK
Transition curve chosen in this study is the cubic parabola
Figure 3 is showing the relationship between deviation angle and tangential angle . Deviation angle is defined
by Equation 9. The formula showing the relationship between deviation angle and tangential angle is in Equation 10. The tangential angle for transitional curves is represented
by Equations 11 and 12. The tangential angle of the central
circular arc is defined by Equations 13 and 14. Superelevation is calculated using Equation 15.
A technique of establishing a composite curve relies
extensively on the use of transparent templates by conventional hand methodology. Pre-computed data from template are compiled into a design table that can be used as an input for the computation of the composite curve referenced completely to a coordinate system. The use of templates and design table relieves the design engineer of much computation and ensures more standardization and higher design standards. Although the conventional hand approach is a standard approach, it is tedious and it is not made in an electronic environment. In recent time, individual engineer’s productivity has been increased by the use of automated procedures that rely extensively on electronic computer. Automated computation of coordinates to readily generate a composite curve is the focus of this study.
Design and setting out of the composite curve on site
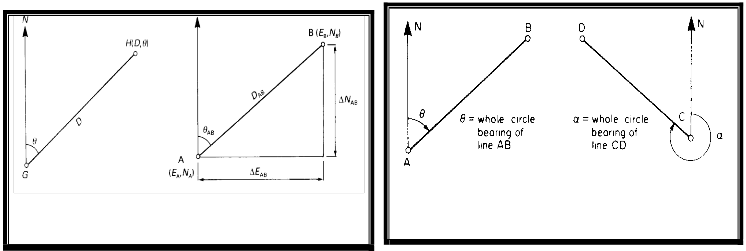
using coordinates methodology require the use of both rectangular and polar coordinates as claimed by Akiije [6]. The methodology requires the determination of eastings, northings and whole circular bearing of each chainage point along the alignment centre line as found in Equations 16 and
17. The variables for Equations 16 and 17 are in Figures 4 and
simply because its formulae and calculations are easier to
5. These variables include: E A
is Easting of A; EB
is Easting
show in written form as claimed by Uren and Price [11].
Figure 1 is showing a typical framework of composite curve.
of B;
N A is Northing of A; N B
is Northing of B;
E AB is
The deflection angle is as measured on site or in the office by
eastings difference from A to B; N AB is northings difference
ICT methods rather than conventional hand method of using
from A to B;
D AB is horizontal length of AB; AB
is whole-
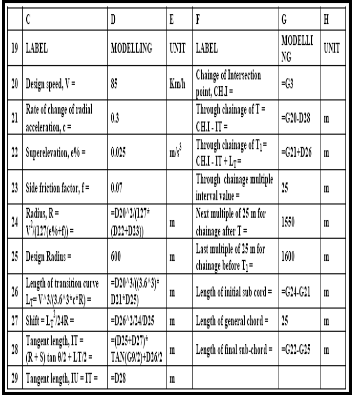
protractor. The radius R of the composite curve as required by the design speed V based upon design standards is possible by using Equation 1. The rate of change of radial acceleration c is defined by equation 2. Transition curve length LT = TT1 T2U as defined by Equation 3.
In Figure 2, the shift at YG or WK is bisected by the transition curve and the transition curve is bisected by the
shift. The shift S is defined by Equation 4. The tangent length
IT = IU is defined by Equation 5. The maximum deviation
circle bearing of line AB.
Hence, in this study, an innovative coordinates methodology of using GPS together with Microsoft Excel is introduced for appropriate cheaper technology of computing coordinates for designing and setting out of a composite curve at a site. In this new methodology, the use of horizontal control points supposedly established by surveyor near the alignment that may not be readily found is not necessary since
IJSER © 2012 http://www.ijser.org
The research paper published by IJSER journal is about A Discrete-event Coordinates Methodology For A Composite Curve 3
ISSN 2229-5518

GPS could be used to capture coordinates of essential points that are required.
Figure 1: Tangent and Curve Length of Cubic
Parabola
Source: Uren and Price [11]
Figure 2: The Shift of a Cubic Parabola
Source: Uren and Price [11]
Figure 3: Relationship Between and
Source: Uren and Price [11]
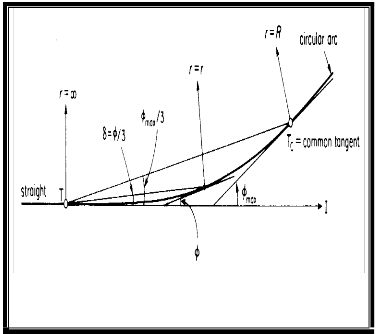
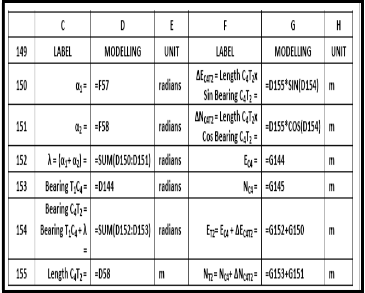
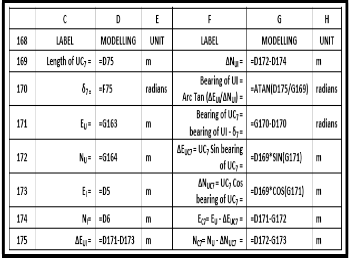
TABLE 1: VARIABLE EQUATIONS FOR A COMPOSITE
CURVE
IJSER © 2012 http://www.ijser.org
The research paper published by IJSER journal is about A Discrete-event Coordinates Methodology For A Composite Curve 4
ISSN 2229-5518
Figure 4: Coordinates Systems
Source : Uren and Price [11]
Figure 5: Whole-Circle Bearings
Source : Uren and Price [11]
3 MATERIALS AND METHODOLOGY
Data capturing and setting out materials for this study include GPS receiver. GPS receiver was able to connect with more than four satellites before coordinates readings and bookings. Computer workstation materials used to design the composite curve being study in this paper comprise the hardware and software components. The hardware components include systems board, central processing unit, memory, disks, a monitor, keyboard as an input device and printer as an output device. The software components used is the Microsoft Excel. Microsoft Excel is a spreadsheet with a table of cells with unique addresses for each cell. The important thing about the table is that data were entered into cells as labels and formulas written for the manipulation of same as modelling. Data modelled gave numerical results as simulation.
In this paper, a road leading to a fruit processing plant is
used as a case study. A GPS receiver was used to capture coordinates (Table 2) of the beacons at the beginning ( E B , N B ) , at an intersection point (EI , N I ) and at
the point where the road to the factory stops ( E S , N S ) . The deflection angle of the connected two straights was
determined within spreadsheet using Table 2. Based on the
design speed of 85 km/h, the length of the transition curve and the tangent lengths were determined in Table 3. Also in Table 3, the determination of the through chainage of the beginning of entry transition curve T and the through chainage of the end of entry transition T1 was defined. Table 4 is the modelling module of tangential angles for through chainages of the entry transition curve. Table 5 is the modelling module for the central circular arc of the composite curve. Table 6 is the modelling module of chord lengths tangential angles for through chainage of the central circular
curve. Table 7 is the modelling module for exit transition curve. Table 8 is the modelling module of chord lengths
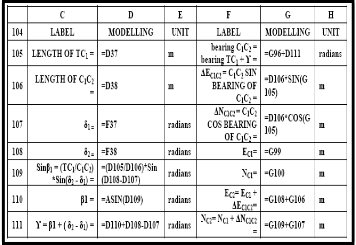
tangential angles for through chainage of the exit transition curve. Table 9 is the modelling module for coordinates of tangent point T, of entry transition curve, chainage 1537.088. Table 10 is the modelling module for coordinates of the initial sub-chord length for point C1 , of the entry transition curve at chainage 1550.000.
Table 11 is the modelling module for coordinates first
general chord length C2 , of the entry transition curve at chainage 1575.000. Table 12 is the modelling module for coordinates the second general chord length C 3 , for the entry transition curve at chainage 1600.000. Table 13 is the modelling module for coordinates of the final sub-chord length for point T1 , of the entry transition curve at chainage
1610.214. Table 14 is the modelling module for coordinates of
initial sub-chord length end point C4 , of circular arc, chainage
1625.000 m.
Table 15 is the modelling module for coordinates of the
final sub-chord length end point T2 , of the circular arc, chainage 1646.833 m. Table 16 is the modelling module for coordinates of tangent point U , of exit transition curve, chainage 1719.960 m. Table 17 is the modelling module for coordinates of the initial sub-chord length for point C7 , of the exit transition curve, chainage 1700.000 m. Table 18 is the modelling module for coordinates first general chord length point C6 , of exit transition curve, chainage 1675.000 m. Table
19 is the modelling module for coordinates for the second general chord length point C 5 , of exit transition curve, at chainage 1650.000 m.
IJSER © 2012 http://www.ijser.org
The research paper published by IJSER journal is about A Discrete-event Coordinates Methodology For A Composite Curve 5
ISSN 2229-5518
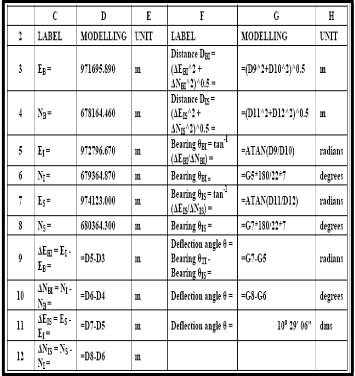
TABLE 2: THE MODELLING MODULE FOR DEFLECTION ANGLE DETERMINATION
TABLE 3: THE MODELLING MODULE FOR ENTRY TRANSITION CURVE
TABLE 4: THE MODELLING MODULE OF TANGENTIAL ANGLES FOR THROUGH CHAINAGES OF THE ENTRY TRANSITION CURVE
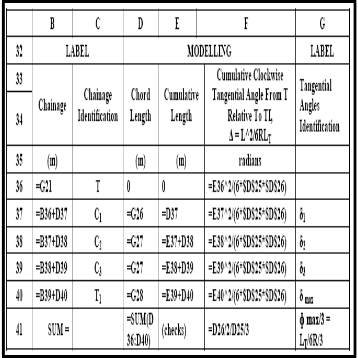
TABLE 5: THE MODELLING MODULE FOR THE CENTRAL CIRCULAR ARC
IJSER © 2012 http://www.ijser.org
The research paper published by IJSER journal is about A Discrete-event Coordinates Methodology For A Composite Curve 6
ISSN 2229-5518
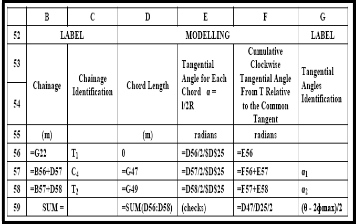
TABLE 6: THE MODELLING MODULE OF CHORD LENGTHS TANGENTIAL ANGLES FOR THROUGH CHAINAGE OF THE CENTRAL CIRCULAR CURVE
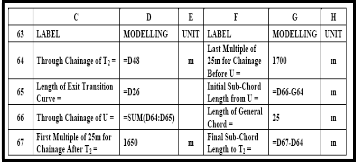
TABLE 7: THE MODELLING MODULE FOR EXIT TRANSITION CURVE
TABLE 8: THE MODELLING MODULE OF CHORD LENGTHS TANGENTIAL ANGLES FOR THROUGH CHAINAGE OF THE EXIT TRANSITION CURVE
TABLE 9: THE MODELLING MODULE FOR COORDINATES TANGENT POINT T, OF ENTRY TRANSITION CURVE, CHAINAGE 1537.088 M
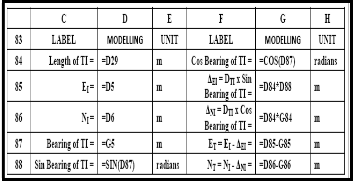
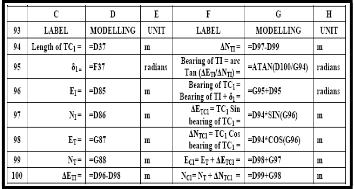
TABLE 10: THE MODELLING MODULE FOR COORDINATES INITIAL SUB-CHORD LENGTH C1 , OF ENTRY TRANSITION CURVE, CHAINAGE 1550.000 M
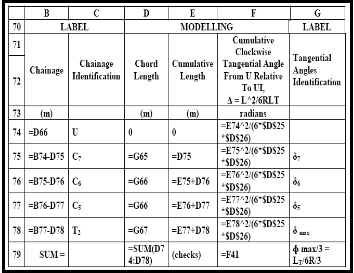
TABLE 11: THE MODELLING MODULE FOR COORDINATES FIRST GENERAL CHORD LENGTH C2 , OF ENTRY TRANSITION CURVE, CHAINAGE 1575.000
M
IJSER © 2012 http://www.ijser.org
The research paper published by IJSER journal is about A Discrete-event Coordinates Methodology For A Composite Curve 7
ISSN 2229-5518
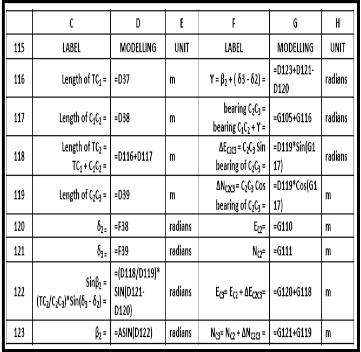
TABLE 12: THE MODELLING MODULE FOR COORDINATES SECOND GENERAL CHORD LENGTH C 3 , OF ENTRY TRANSITION CURVE, CHAINAGE 1600.000 M
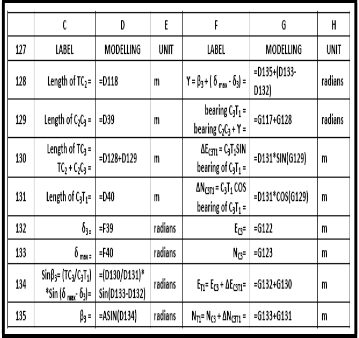
TABLE 13: THE MODELLING MODULE FOR COORDINATES OF THE FINAL SUB-CHORD LENGTH FOR POINT T1 , CHAINAGE 1610.214 M
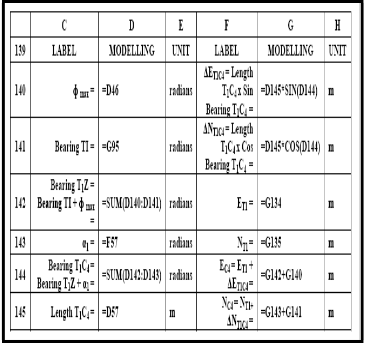
TABLE 14: THE MODELLING MODULE FOR COORDINATES INITIAL SUB-CHORD LENGTH END POINT C4 , OF CIRCULAR ARC, CHAINAGE 1625.000 M
TABLE 15: THE MODELLING MODULE FOR COORDINATES OF THE FINAL SUB- CHORD LENGTH END POINT T2 , OF THE CIRCULAR ARC, CHAINAGE
1646.833 M
IJSER © 2012 http://www.ijser.org
The research paper published by IJSER journal is about A Discrete-event Coordinates Methodology For A Composite Curve 8
ISSN 2229-5518
TABLE 16: THE MODELLING MODULE FOR COORDINATES TANGENT POINT U, OF EXIT TRANSITION CURVE, CHAINAGE 1719.960 M
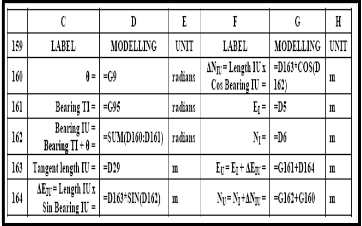
TABLE 17: THE MODELLING MODULE FOR COORDINATES OF THE INITIAL SUB- CHORD LENGTH FOR POINT C 7 , OF THE EXIT TRANSITION CURVE, CHAINAGE 1700.000 M
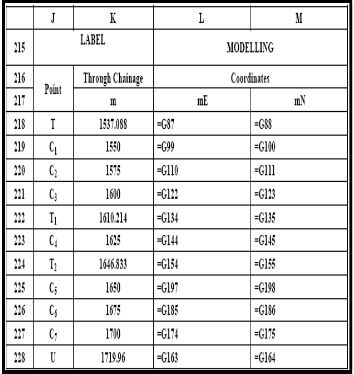
4 RESULTS AND DISCUSSION
The summary of the modelling that processed the coordinates of points to define the composite curve is shown in Table 20. Table 21 is showing the summary of the simulation of coordinates for the design and setting out of the composite curve on site. Modelling modules of Table 2 through Table 19 allow iteration process by engineers to automate design variables through a discrete-event simulation design process to develop coordinates for a composite curve. This is accomplished through an integrated ICT design environment that links design activities of entry transition curve, circular arc and exit transition curve to produce coordinates for a composite curve.
TABLE 18: THE MODELLING MODULE FOR COORDINATES FIRST GENERAL CHORD LENGTH POINT C 6 , OF EXIT TRANSITION CURVE, CHAINAGE
1675.000 M
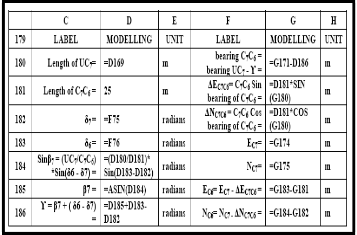
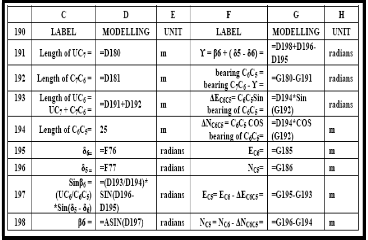
TABLE 19: THE MODELLING MODULE FOR COORDINATES FOR THE SECOND GENERAL CHORD LENGTH POINT C 5 , OF EXIT TRANSITION CURVE, CHAINAGE 1650.000 M
Numerous design iterations for the purpose of improving and refining the coordinates to develop a composite curve without expending a large amount of time or effort are possible using the modelling tables. The developed modelling tables within spreadsheet environment are valuable features with the ability to view the resulting effect of the computation of coordinates and modifications. Hence, coordinates for a composite curve are automatically carried out via a discrete-event methodology without the need to conduct the numerous intermediate steps that have been associated with the conventional manual design method. The method developed here does not need the
IJSER © 2012 http://www.ijser.org
The research paper published by IJSER journal is about A Discrete-event Coordinates Methodology For A Composite Curve 9
ISSN 2229-5518
involvement of vendors to complement design activities as in the case of specific purpose application programs and the system operation is not under license.
5 CONCLUSIONS AND RECOMMENDATIONS The following conclusions and recommendations are derived from the investigation carried out in this study.
5.1 CONCLUSIONS
1. A new methodology of computing coordinates for designing a composite curve via a discrete-event simulation approach in an ICT environment has been vividly carried successfully.
2. This novel methodology has been successfully carried
out by making use of coordinates generated by GPS on
site and advancing same in Microsoft Excel to compute coordinate to design a composite curve.
3. The process allows coordinates to be computed for a composite curve by using various related variables that change instantaneously at separate points in different modelling module tables while making use of a readily available general purpose application program.
4. The result is similar to the conventional hand method of computation but this novel methodology is in an electronics environment.
5. The methodology is amenable to intranet and internet
and allows various engineers to work on a composite
curve for improvement optimally.
6. The process has the ability to enhance the productivity of
highway engineers to conduct numerous iteration of computations for a composite curve coordinates for the purpose of improving and refining without expending a large amount of time or effort.
5.2 RECOMMENDATIONS
1. The methodology is highly recommended as a better alternative to the use of programming software, specific purpose application programs and conventional hand method in the computation of coordinates for design of road or rail composite curve.
2. The methodology is also highly recommended as a better
alternative while setting out of road or rail composite
curve.
TABLE 20: MODELLING MODULE SUMMARY OF THE COMPOSITE CURVE COORDINATES
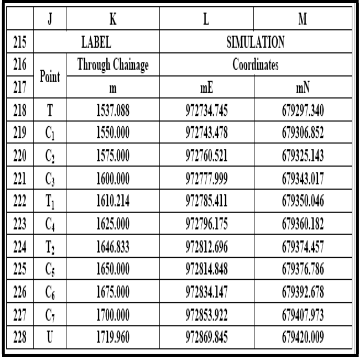
TABLE 21: SUMMARY OF THE COMPOSITE CURVE COORDINATES SIMULATION MODULE
IJSER © 2012 http://www.ijser.org
The research paper published by IJSER journal is about A Discrete-event Coordinates Methodology For A Composite Curve 10
ISSN 2229-5518
REFERENCES
[1] T. J. Schriber and D. T. “Brunner Inside Discrete-Event
Simulation Software How It Works and Why It Matters,”
Proceedings of the 37th Conference on Winter Simulation, pp.167-177, 2005.
[2] A. M. Law and W. D. Kelton. “Simulation Modeling and
Analysis’ 3rd Edition, Tata McGraw-Hill, New Delhi,
2007.
[3] J. S. Carson. “Introduction to Modelling and Simulation,” Proceedings of the 37th conference on winter simulation, pp.16-23, 2005.
[4] A. S. Adedimila and I. Akiije. “National Capacity Development in Highway Geometric Design,” Proceedings, National Engineering Conference. The Nigerian Society of Engineers, Abeokuta, 228-235, 2006.
[5] I. Akiije and S. A. Adedimila. “A New Approach to the Geometric Design of Highway Alignments Using a Microcomputer,” Proceedings of the International Conference in Engineering, paper 43, at the University of Lagos, Lagos, Nigeria, 2005.
[6] I. Akiije. “An Optimal Control for Highway Horizontal Circular Curve Automation,” Proceedings of International Conference on Innovations in Engineering and Technology, Faculty of Engineering, University of Lagos, Akoka, Lagos, pp 669-681, 2011.
[7] I. Akiije. “An Analytical and Autograph Method for Highway Geometric Design,” Ph.D. Thesis, School of Postgraduate Studies, University of Lagos, Akoka, Lagos, 2007.
[8] C. Tiberius. “Standard Positioning Service,” Handheld GPS
Receiver Accuracy in GPS World, Vol. 14, No. 2 pp. 44-51,
2003.
[9] K. McDonald. “GPS Modernization Global: Positioning
System Planned Improvement,” Proceedings ION Annual
Meeting pp. 36-39, 2005.
[10] Andrzej Kobryn. “Polynomial Solutions of Transaction Curves,” Technical Papers, Journal of Surveying Engineering / Volume 137/Issue 3, 2011.
[11] J. Uren and W. F. Price. “Surveying for Engineers.” 5th
Edition, Palgrave Macmillan, Great Britain, 2010.
IJSER © 2012 http://www.ijser.org