International Journal of Scientific & Engineering Research, Volume 6, Issue 5, May-2015 1802
ISSN 2229-5518
A COMPARATIVE ANALYSIS OF MOISTURE CONTENT VARIATION ON FLOW AND MECHANICAL PROPERTIES OF BREADFRUIT SEED
(ARTOCARPUS ALTILIS)
Abodenyi V.A1, S.E Obetta2 and Kaankuka T. P3
1Department of Agric. and Bio-Environmental Engineering
Technology, Federal Polytechnic Bauchi
2,3Department of Agricultural and Environmental Engineering, University of Agriculture Makurdi
E-mail vicabode@yahoo.com
ABSTRACT
Determination of some engineering properties of two varieties of breadfruit seed was carried out using standard procedures. The initial moisture content was 6.85% and later adjusted by rewetting to 14.85%, 21.85% and 28.85 %(wb). Angle of repose and coefficient of friction of the two varieties were also determined on three surfaces (plywood, glass and Aluminium). The mechanical properties at compressive yield were determined using universal testing machine. Data obtained were statistically analyzed using Minitab statistical software. Results showed var. Africana values are in the following ranges: angle of repose plywood (20.84 to
33120) on glass (17.04 to 29.560) and on aluminum (16.57 to 29.060). Coefficient of friction
on plywood was (0.376 to 0.496), on glass (0.325 to 0.450) and on aluminum (0.368 to
0.469). While var. inversa have the following values for angle of repose plywood (17.04 to
22.970) on glass (20.38 to 30.07) and on aluminium (20.50 to 29.32). Coefficient of friction on plywood was (0.344 to 0.459), on glass (0.279 to 0.396), and on aluminium (0.348 to
0.433). These properties increased with increase in moisture content. The fracture resistance of var. africana and var. inversa were found to decrease with increase in moisture content. The data obtained from this study will aid in the design and construction of breadfruit seed threshing machine.
Keywords; Breadfruit seed, var. Africana, var. inversa, moisture content, fracture resistance
1.0 Introduction
The breadfruit (Artocarpus altilis) is a native to vast areas which include amongst others, New Guinea, the Indo- Malayan Archipelago and Western Micronesia. It is largely cultivated within the rainforest belt of West, Central and East Africa as well as Madagascar (Julia, 1987). The African breadfruit seed is an important food item, popularly known as ukwa by the Ibo, afon in Yoruba, ize in Benin, izea in Ijaw and
IJSER © 2015 http://www.ijser.org
International Journal of Scientific & Engineering Research, Volume 6, Issue 5, May-2015 1803
ISSN 2229-5518
ediang in Efik (Nwokolo, 1996). Eaten in a variety of ways, breadfruit can also be made into flour. The breadfruit flour is glutin-free and it is an excellent source of potassium, carbohydrate and fiber. The seed can be cooked as porridge or mixed with other food stuff such as sorghum (Onweluzo and Nnamuchi 2009), or roasted and sold with palm kernel as road side snacks. The flour has high potential usage for pastries (Onyekwelu and Fayose, 2007).
Recent studies have shown that the oil from breadfruit seed is economically viable as vegetable oil, yielding up to 10.23% of oil per kg of processed seeds. This value compares favourably with oils from common oil seeds like cotton seed (gossipol) and palm kernel which are currently used for commercial oil production. The presence of linoleic acid in the oil gives the seed a high nutritional quality as source of essential fatty acid. Breadfruit seed is highly nutritious and the diet is gaining popularity worldwide (Nwokolo, 1996). To design equipment for product handling (bins, silos, hoppers), angle of repose and coefficient of friction are important for solid flow and storage structure, the coefficient of frction between seed and wall in the prediction of seed pressure on walls (Gumble and Maina, 1990). Angle of repose of a product determines the flow ability of the product. It is a measure of the internal friction between grains and can be useful in hopper design to ensure continuous flow of the material by gravity. The coefficient of friction helps in determining the angle at which chutes should be positioned so as to achieve steady flow of the material through the chute (Ghasemi et al., 2007). In Nigeria presently there is no mechanized production and processing of the seeds at industrialized scale. The knowledge of the flow and mechanical properties of this seed is scanty making the design and fabrication of machines relevant to bulk handling, harvesting, decortications, storage and extraction of oil from seed non- existent.
The objective of this study is to investigate some selected engineering properties of two varieties of bread fruit seed (var. Africana and var. inversa) at four different moisture content levels, and to ascertain their possible contributions in terms of design considerations in the production of bread fruit processing machines.
2.0 Materials and Methods
2.1 Experimental Design and Statistical Analysis
The experimental design was a 2×4×5 factorial design. Two varieties of bread fruit seed (var. Africana and var. inversa) were used at four different moisture content levels and each parameter determined were replicated five times.
Minitab statistical software was used in the analysis of variance (ANOVA) to determine the variation in results of all the experiments under the various independent variables and their interaction at 95% level. Furthermore, separation of means was performed using Least Significant Difference (LSD) at 95% level of significance to determine the significant difference between the moisture contents and varieties.
Regression analysis was performed to determine the relationship between the observed parameters and the treatment variables. These relationships are represented graphically and model equations generated.
IJSER © 2015 http://www.ijser.org
International Journal of Scientific & Engineering Research, Volume 6, Issue 5, May-2015 1804
ISSN 2229-5518
2.2 Sample Collection and preparation
Seventy kilograms each of undehulled var.Africana and var. Inversa breadfruit seeds were purchased from Nsukka main market in Enugu State, Nigeria. The initial moisture content (m.c) of the sample was 6.85% (wb) for var. Africana and 6.02% (wb) for var. inversa. The samples were divided into 5 parts of 14 kg each. The moisture contents of the samples were adjusted to four different moisture content levels of 6.85, 14.85, 21.85 and 28.85% (wb) as suggested by Adindu and Williams, (2003). These moisture levels were chosen since all processing operations and storage are performed in these ranges.
2.2.1 Initial moisture content determination
The procedure for determining m.c as proposed in ASAE S352.2 (2003) was adopted. Electric oven (Gallenkamp oven 300 plus series), carrying cans, and electronic weighing balance (WENSAR PGB Series) with accuracy of 0.01g were used to determine moisture content of the two varieties of breadfruit seed. The initial average moisture content was determined by oven method. Four
samples of 15 g were heated for twelve hours at 103±20c in the oven until
constant weight is reached (Mahbobeh et al., 2011). The experiment was replicated five times and the average weight recorded. The moisture content was calculated using equation below
Where;

𝑀. 𝐶 = Mb− Ma
(w.b) Mb−Mc
× 100% …………………(1)
𝑀. 𝐶(w.b) = moisture content (wet basis)
Mb = the weight of moisture Can plus sample weight before
oven-drying (gm)
Ma = the weight of moisture Can plus sample weight after oven-drying (gm)
Mc = weight of moisture Can (gm)
2.2.2 Moisture Content Adjustment
The moisture content of the sample was adjusted to four levels, 6.85%,
14.85%, 21.85% and 28.85 % (wb) (Oluwole et al; 2007, Olatunde, 2011). Each sample weighing 14kg was sealed in separate polythene bags with the calculated amount of distilled water that changed the moisture content to the desired level. The quantity of distilled water that was added in order to adjust the moisture was calculated using equation 2; (Davies and Zibokere, 2011)

𝑀 = 𝑊 � 𝑀1− 𝑀2 � ………….................………..……… (2)
100−𝑀1
Where;
Ws = weight of sample (kg)
M = weight of distilled water that was added (kg)
IJSER © 2015 http://www.ijser.org
International Journal of Scientific & Engineering Research, Volume 6, Issue 5, May-2015 1805
ISSN 2229-5518
M1 = initial moisture content (%)
M2 = final moisture content (%)
After sealing the seed in polythene bags they were kept in the refrigerator at a temperature of 5oC for one week to create an enabling condition for uniform moisture distribution within the seeds (Davies and El- Okene, 2009)
2.3 Determination of Breadfruit Flow Properties
2.3.1 Coefficient of Friction
The static coefficient of friction (µ) of breadfruit seed was determined on three surfaces namely aluminum, plywood and glass. A topless and bottomless material box of 150 mm ×
150 mm × 40 mm was filled with sample and placed on adjustable tilting table onto which the material to be tested was fastened. The box was placed on one side of the surface and raised slightly so that it was not touching the material. A screw jack was used to gently tilt the table until friction force between the seeds and the material was overcome by the gravity and moved down the slope. The angle of inclination was read from the graduated protractor attached to the tilting table. The mean value of five replicates was recorded, (Alonge and Adegbulugbe, 2005).
2.3.2 Angle of Repose of Breadfruit Seeds
Angle of repose (θ) was determined using an open ended cylinder of diameter 15cm and height 60cm. The cylinder was placed at the centre of a circular plate of 80 cm, and then filled with breadfruit seeds. The cylinder was lifted slowly until the seeds formed a cone on the circular plate. The diameter and height of the cone was measured and recorded and the angle of repose was calculated. This was replicated five times using the three different surfaces (plywood, glass and aluminum). These surfaces were used because they are common materials used for grain handling processes (Juana et al., 2008). Equation 1 was used to calculate the angle of repose (Dash et al., 2008)

θ = tan−1 �2H� …………………………… (1)
D
Where :
θ = angle of repose
H= the height of the cone (cm) D = diameter of cone (cm)
2.4 Determination of Mechanical properties of Breadfruit Seed
Compressive test was performed on the two varieties of breadfruit seed using a Universal Testing Machine (UTM) of the National Centre for Agricultural Mechanization (NCAM), Ilorin, Kwara State Model M500-100, 100kN, Istron Corporation USA. Seeds at different orientations (length, width and thickness) were loaded using the machine. The test result and graphs were automatically generated. The applied forces at bioyield and their corresponding deformations for each sample were read directly from the force – deformation curve. Data generated include force at yield, strain at yield, and stress at yield and compressive extension at yield. For each of the moisture content, the experiment was replicated five times.
3.0 Results and Discussions
IJSER © 2015 http://www.ijser.org
International Journal of Scientific & Engineering Research, Volume 6, Issue 5, May-2015 1806
ISSN 2229-5518
3.1 Effect of variation of moisture content on angle of repose
Figures 1 and 2, shows the influence of moisture on the angle of repose of var. Africana and var. Inversa for three structural surfaces respectively. It was observed that increase in moisture content from 6.85% to 28.85% (wb) increased the angle of repose from 20.840 to 33.20 for var. Africana and from 22.97 to 34.340 for var. Inversa on plywood. Table 1 shows the mean effect of moisture content on var. Africana and var. inversa.
Also on glass it increased from 17.04 to 29.56o for var africana and 20.38 to
30.07o for var. inversa. There was also an increase in the angle of repose on the Aluminum for var. Africana which ranges from 16.57 to 29.060 and 20.50 to 29.32o for var inversa as the moisture increased. These values for angle of repose for var. africana and var. inversa were found to be within the value reported for other crops (Garnayak et al (2008) for jatropha seed, and Solanki et al (2011) for neem fruit and seed).
The increase in the angle of repose for these breadfruit varieties is attributed to increase in size of the seeds as reported by Olalusi et al (2009) and Arthur (2009). The regression equation relating the angle of repose to moisture content on different surfaces are presented below
Var africana,
θPlywood = 0.592mc + 17.50 (R2 =0.937) ………..(2) θGlass = 0.561mc + 13.15 (R2 = 0.997) ……….(3) θAlum = 0.577mc + 12.81 (R2 = 0.993) ……….(4)
Var inversa,
θPlywood = 0.464mc + 21.31 (R2 = 0.86) ………. (5) θGlass = 0.424mc + 18.32 (R2 = 0.930) ……….(6) θAlum = 0.398 mc + 18.60 (R2 = 0.920) ……….(7)
From the statistical analysis, the effect of moisture content on the angle of repose of the two varieties on the three surfaces was significant at 0.05 probability level (Appendix A)
3.2 Effect of Moisture Content on Coefficient of Friction of Breadfruit Varieties.
The effect of moisture on coefficient of fiction for the three surfaces, plywood, glass and aluminum for var africana and var. inversa are shown in figure 3 and 4 respectively. Table 2 below shows the mean effect of moisture content and variety on breadfruit varieties. It was observed that static coefficient of friction on the three surfaces increased with increase in moisture levels. Var. africana increased from 0.376 to 0.496 and var. inversa increased from 0.344 to 0.459 on plywood respectively. On the glass, var. Africana increased from 0.325 to 0.450, and 0.279 to 0.396 for var. Inversa, while on Aluminum the increase was from 0.368 to 0.469 for var. africana and 0.348 to 0.433 for var. inversa respectively. The result showed that var. africana has higher coefficient of friction than var. inversa; this can be attributed to the cohesive force exerted by the seeds on the surface of contact at higher moisture levels. This result is similar to that obtained by Davies and Zibokere (2011) for cowpea varieties and Coskun et al (2005) for sweet
corn.
IJSER © 2015 http://www.ijser.org
International Journal of Scientific & Engineering Research, Volume 6, Issue 5, May-2015 1807
ISSN 2229-5518
At all the moisture content levels the highest coefficient of friction were observed for plywood followed by aluminum while the least value was for glass. This might be due to the increase in the size of the seed at higher moisture, and rough surface of the seeds that could limit sliding. The low value of coefficient of friction for glass occurred due to the polished nature and smoothness of the structural surface. The regression equation is shown below for the range of moisture content considered.
Var africana
μplywood = 0.005mc +0.352 (R2 = 0.913) ……… (8) μGlass = 0.005mc + 0.296 (R2 = 0.964) ……… (9) μAlum = 0.004mc + 0.348 (R2 = 0.928) ……… (10)
var inversa
μplywood = 0.005mc + 0.305 (R2 = 0.984) ……... (11) μGlass = 0.005mc + 0.243 (R2 = 0.948) ……... (12) μAlum = 0.004mc + 0.319 (R2 = 0.938) ……… (13)
The statistical analysis indicates that the effect is significant on plywood and aluminium at
0.05 probability level but showed not significant for glass. This property is needed in the design of agricultural machine hopper and other conveying equipment; it determines the flowability of the material in handling operations.


Table 1: Mean values for angles of repose at different surfaces
Variety | Moisture content % | Plywood | Glass | Aluminum |
Var.africana | 6.85 | 20.84 | 17.04 | 16.57 |
Var. inversa | 14.85 21.85 28.85 6.85 14.85 21.85 28.85 | 26.45 32.39 33.20 22.97 29.97 32.75 34.34 | 21.60 25.04 29.56 20.38 25.45 28.68 30.07 | 21.41 26.01 29.06 20.50 25.27 28.47 29.32 |

IJSER © 2015 http://www.ijser.org
International Journal of Scientific & Engineering Research, Volume 6, Issue 5, May-2015 1808
ISSN 2229-5518


Table 2: Mean values for coefficient of friction at different surfaces
| Variety | Moisture content % | Plywood | Glass | Aluminum |
| Var.Africana | 6.85 | 0.38 | 0.33 | 0.37 |
| Var. Inversa | 14.85 21.85 28.85 6.85 14.85 21.85 28.85 | 0.45 0.48 0.49 0.34 0.38 0.43 0.46 | 0.39 0.42 0.45 0.28 0.32 0.39 0.39 | 0.43 0.44 0.47 0.35 0.37 0.43 0.43 |

40
y = 0.5921x + 17.502
35 R² = 0.9373
30 y = 0.5771x + 12.817
R² = 0.9939
25
20 y = 0.5613x + 13.152
R² = 0.9976
15
10
Plywood
Glass
Alum
5
0
0 5 10 Mois1tu5re cont2e0nt(%) 25 30 35
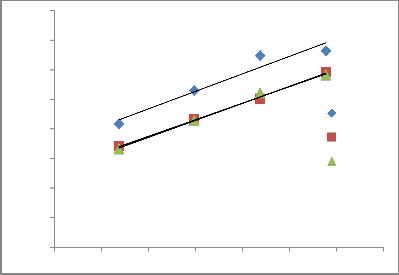
Fig. 1: Effect of moisture on angle of repose of var africana on different surfaces.
IJSER © 2015 http://www.ijser.org
International Journal of Scientific & Engineering Research, Volume 6, Issue 5, May-2015 1809
ISSN 2229-5518
40
y = 0.4645x + 21.316
35 R² = 0.86
30 y = 0.4249x + 18.327
25 R² = 0.9306
20
y = 0.3989x + 18.605
15 R² = 0.9202
10
ply glass alum
5
0
0 10 20 30 40
Moisture content (%)

Fig.2: Effect of moisture content on angle of repose of var inversa
0.6
0.5
0.4
y = 0.0055x + 0.3523
R² = 0.9133 y = 0.0055x + 0.2962
R² = 0.9641
0.3
0.2
0.1
y = 0.0044x + 0.348
R² = 0.9285
plywood glass aluminum
0
0 10 20 30 40
Moisture content (%)
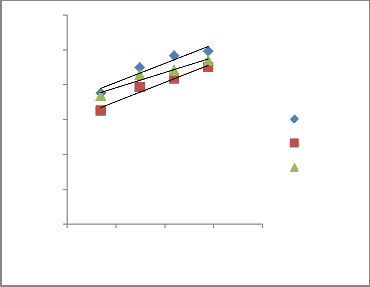
Fig. 3: Effect of moisture content on coefficient of friction of var Africana
IJSER © 2015 http://www.ijser.org
International Journal of Scientific & Engineering Research, Volume 6, Issue 5, May-2015 1810
ISSN 2229-5518
0.5
0.45
0.4
0.35
0.3
0.25
0.2
0.15
0.1
0.05
0
y = 0.0054x + 0.3054
R² = 0.9842 y = 0.0057x + 0.2431
R² = 0.9485
y = 0.0042x + 0.3191
R² = 0.9383
0 10 20 30 40
Moisture content (%)
plywood glass aluminum
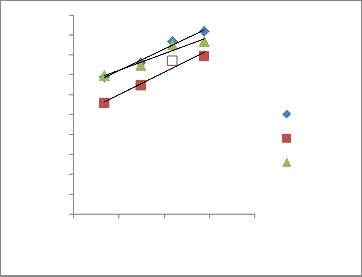
Fig. 4: Effect of moisture content on coefficient of friction of var. inversa
3.3 Effect of Moisture Content Variation on Force at Yield
The crushing strength was found to reduce from 6.07N to 4.086N and then increased as the moisture increased there after reduced to 4.672N as the moisture increased from
6.85% to 28.85% for var. Africana. The rupture force for var. Inversa decreased with increase in moisture content. The result agrees with the earlier findings of Owolerafe et al (2007) for fresh oil palm fruit, Adedeji (2012) for neem seed and Kernel and Solanki et al (2007) for neem fruit.
This rupture force at higher moisture content might have resulted from the fact that the seed tended to be very brittle at high moisture content The correlation between rupture strength and moisture content is represented by the equations below,
Force at yldAfri = -0.036mc + 5.806 (R2 = 0.135)…….(14) Force at yldInv = -0.435mc + 18.1 (R2 = 0.751) …… (15)
Statistical analysis of the effect of moisture on the crushing force (Appendix B) shows that there is significant difference for the range of moisture content levels at (P<0.05). Experimental result shows a reduction in the force required for initiating seed rupture as the moisture content increased.
3.4 Effect of Moisture Variation on Compressive Strain at yield
As the moisture increased from 14.85 to 28.85% wb the compressive strain at yield decreased from 2.437% to 0.172% for var. invera and from 0.219 to 0.193 for var. africana. The ratio of the size of the seed under pressure is important in deciding the screen size in the design of a decorticator and cleaner.
The regression analysis shows the relationship between strain and moisture content.
Comp strainAfri = -0.018mc +0.311 (R2 = 0.519) ……(17) Comp strainInv = -0.455mc + 75.009 (R2 = 0.959) …… (18)
The result of the statistical analysis on the effect of moisture on the compressive strain shows that the effect was highly significant for the two varieties at 0.05 significant level.
IJSER © 2015 http://www.ijser.org
International Journal of Scientific & Engineering Research, Volume 6, Issue 5, May-2015 1811
ISSN 2229-5518
Also the mean comparison using LSD at 0.05 confidence interval shows significant effect between the treatment means.
3.5 Effect of Moisture Content on Compressive Stress of Breadfruit varieties
The compressive stress at yield reduced as moisture increased from 14.85% to
28.85% wb as shown in table 6, the compressive stress decreased from 5.026 N/mm2 to
2.999 N/mm2 for var. Inversa and from 2.303 to 1.259N/mm2 for var Africana. The regression equation relating moisture content and compressive stress at yield is presented
below
Comp stressAfri = -0.039mc + 2.230 (R2 = 0.464) …… (19) Comp stressInv = 0.026mc + 2.563 (R2 =0.031) ……. (20)
The result of the statistical analysis shows that the effect was not significant at 0.05 significant level.
3.6 Effect of Moisture and Variety on Young’s Modulus of Var. Africana and
Var. Inversa.
The mean values of the young’s modulus decreased from 1032.76 to 954.86N/mm2 at 2.5mm/min loading as the moisture content increased from 6.85 to 14.85% it later increased as the moisture content increased to 28.85%, while for var. Inversa the young’s modulus was 81.235N/mm2 at 6.85% moisture content, then an increase was observed at
14.85% to 2540.21N/mm2 followed by reduction in the value of the young’s modulus as
the moisture increases to 28.85%.
Haddad et al (2010) reported a decreasing trend in this property in their work on wheat Kernel. This could be attributed to the fact that as the moisture content increased the molecules become softer and consequently mobile thus the decrease in the mean values. Bamgboye and Adejumo (2011) also reported a similar trend for roselle seeds.
The regression equation relating young’s modulus with moisture content is shown in the equation below. The statistical analysis showed that there was no significant effect for moisture and also for interactive effect of moisture and variety on young’s modules at 0.05 probability level.
Y.modAfri = 10.62mc + 870.8 (R2 = 0.403) ……. (21)
Y.modAfi = 84.64mc + 184.1 (R2 =0.513) ……. (22)
IJSER © 2015 http://www.ijser.org
International Journal of Scientific & Engineering Research, Volume 6, Issue 5, May-2015 1812
ISSN 2229-5518

Table 3: Mean values of Compressive Strength properties at different moisture content
Variety | Moisture Content (%) | Force at Yield (N) | Strain at Yield (%) | Stress at Yield (N/mm2) | Young Modulus (N/mm2) |
Var.Africana | 6.85 | 6.07 | 0.219 | 2.303 | 1032.76 |
Var.Inversa | 14.85 21.85 28.85 6.85 14.85 21.85 28.85 | 4.09 5.77 4.67 14.84 13.68 5.37 6.99 | 0.115 0.190 0.193 2.437 0.212 0.144 0.172 | 1.078 1.449 1.259 1.626 5.026 2.546 2.999 | 954.86 970.80 1294.51 81.24 2540.21 1980.86 2262.27 |

Conclusion
The effects of variety and moisture content on the flow properties were significant. The effect of moisture content on variety on the mechanical property tested has significant effect except for stress at yield that moisture showed no significant effect.
The angle of repose on plywood, glass and aluminium increased from 22.97 to 34.340,
20.38 to 30.070 and 20.50 to 29.320 for Var Africana on the three structural surfaces while for var. inversa it increased from 20.84 to 33.20, 17.04 to 29.560 and 16.57 to 29.060 respectively as the moisture content increased from 6.85 to 28.85% wb.
The coefficient of friction on plywood, glass and aluminium increased from 0.376 to
0.496, 0.325 to 0.450 and 0.368 to 0.469 for Var. Africana while for Var Inversa on the same structural surfaces increased from 0.344 to 0.459, 0.279 to 0.396 and 0.348 to 0.433 respectively a the moisture increased. The information will be useful in designing hopper for the necessary processing machines for the breadfruit varieties. The fracture resistance of var. Africana and Var Inversa were found to decrease with increase in moisture content.
References
Adedeji, M .A. (2012). The Selected Engineering properties of neem seed M.sc project, Obafemi Awolowo University Ile- Ife. 1- 47.
Adejumo A.O, Ajav E.A, Igbeka J.C and Ilori T.A (2011). Effects of Moisture Content and Varieties on Selected Mechanical Properties of okra. Proc. 11th International Conference of NIAE, Ilorin 2011, 17-20
Adindu, M.N and Williams J.O (2003). Effect of storage on dehydrated African breadfruit seeds (Treculia Africana). Plant foods for human nutrition 58(3): 1- 8.
Alonge A.F and Adegbulege T. A. (2005). Some Physical Properties of
IJSER © 2015 http://www.ijser.org
International Journal of Scientific & Engineering Research, Volume 6, Issue 5, May-2015 1813
ISSN 2229-5518
groundnut. Journal of Agricultural Engineering and Technology (JAET) vol.13,
34-41
Arthur M.A (2009). Moisture – dependent physical properties of Cowpea. Unpublished B.Sc. Thesis, Department of Agricultural and Environmental Engineering, Niger Delta University Bayelsa State. 64pp
Bamgboye A.I and Adejumo O.I (2011), Mechanical properties of Roselle Seed
Agricultural Sc. Research Journal Vol. 1(8) Pp 178-183
Coskun M.B; Yalcin I. and Ozarsclan C. (2005). Physical Properties of Sweet corn seed (Zeameys Saccharata Sturt). Journal of Food engineering 74:523-528
Dash, A.K, Pradhan L.M and Naik S.N (2008). Some Physical properties of simarouba fruit and kernel Int. Agro physics, 22. 111 – 116.
Davies, R.M and Zibokere, D.S (2011). Effects of moisture content on some physical and mechanical properties of three varieties of cowpea (Vina Unguiculta (L) walp). Agricuitural Engineering International:CIGR Journal vol. 13(1)
Garnayak, D.K, Pradhan, R.C and Bhatnagar, N. (2008) Moisture dependent physical properties of Jatropha seed. Industrial crops product 27, 123-129
Haddad Y, Benet J.C, Delence J.Y Merme A, and Abecassis J (2010) Rheological behaviour of wheat endosperm-proposal for classification based on rheological Characteristics of endosperm test Samples J. Cereaal Sci. 34:105-113
Juana S. M., Aurelio D.L, Salvador, N.G and Jose A. L. (2008). Some Physical Properties of Roselle (Hibiscus sabdarriffa l ) seeds as a function of moisture content. Journal of food Engineering 87(2008) 391-397.
Julia M. (1987). Breadfruit (Artocarpus altilis). In fruits of warm climates. Published by Julia F. Morton. Miami FL, p50 - 58.
Mahbobeh, F; Vahid, E. Seyed M. and Mohammed G. (2011). Physical, mechanical and aerodynamic properties of acorn as potentials for development of processing machines. Aus. Journal of crop Science. AJCS 5(4): 473-478 ISBN:
1635 – 2707.
IJSER © 2015 http://www.ijser.org
International Journal of Scientific & Engineering Research, Volume 6, Issue 5, May-2015 1814
ISSN 2229-5518
Nwigbo, S.C, Achebe, C.H, Chinwuku, E.C and Tagbo, D.A (2008). Design of breadfruit shelling machine. An international multi – disciplinary journal vol
2(4): 1-16
Nwokolo E (1996). African Breadfruit (Trecula African Decne) and Polynesian breadfruit (artocapus altilis) In Nwokolo E, Smarth J (eds) legumes and oil seeds in nutrition, Chapman and hall London Pp 345 – 354.
Olatunde G.A (2011). Mechanical extraction of oil from neem seed. Unpublished Master thesis, Department of Agricultural and Environmental Engineering, Obafemi Awolowo University, Ile- Ife.
Oluwole. F.A, Abdulrahim A.T, and Olalere R.K (2007). Effect of moisture on crackability of Bambara groundnut using a centrifugal cracker. Int Agro physics
21, 179 – 184
Onweluzo J.O and Nnamuchi O.M (2009). Production and evaluation of porridge – type breakfast production from Trecula Africana and sorghum bicolor flours. Pakistan Journal of Nutrition 8(6): 731 -736
Onyekwulu J.C and Fayose O.J (2007). Effect of storage methods on the germination and proximate composition of Treculia Africana seeds. Conference on International Agricultural research for development. University of Kessel – Witzenhauesen and university of Gottingen, October 9 -11, 2007.
Owolarafe O.K, Olabige M.T and Faborode M.O (2007). Physical and mechanical properties of two varieties of fresh oil palm fruit. Journal of food Engineering 78: 1228- 1232
Solanki, R.C, Naik S.N, Sarivastava, A.P and Santosh S. (2011). Physical and mechanical properties of neem fruit and seed relevant to depulping and decoration. Journal of Agricultural Engineering, vol. 48 (3): 52 - 57
IJSER © 2015 http://www.ijser.org
International Journal of Scientific & Engineering Research, Volume 6, Issue 5, May-2015 1815
ISSN 2229-5518

Appendix A: Mean Comparison of angle of repose and static coefficient of friction on breadfruit varieties as affected by structural surface material and moisture content
Variety | C of F. plywood | C of F. glass | C of F. Aluminum | A of repose ply. | A. of repose Glass | A. of repose Alum. |
Africana | 0.45125 | 0.39605 | 0.42670 | 28.212 | 23.309 | 23.262 |
Inversa | 0.40275 | 0.34590 | 0.39450 | 30.009 | 26. 146 | 25.889 |
LSD | 0.0077 | 0.0102 | 0.0086 | 0.439 | 0.5078 | 0.4889 |
M.C(%) |
6.85 | 0.36020 | 0.30230 | 0.35810 | 21.905 | 18.708 | 18.535 |
14.85 | 0.41470 | 0.35780 | 0.40060 | 28.195 | 23.527 | 23.336 |
21.85 | 0.45820 | 0.44060 | 0.43290 | 32.570 | 26.863 | 27.242 |
28.85 LSD | 0.47490 0.0111 | 0.42320 0.0147 | 0.45080 0.0124 | 33.772 0.6321 | 29.812 0.7308 | 29.188 0.6914 |

Appendix B: Mean Comparison of Compressive test on breadfruit
Seed varieties
Variety | Force at yield | Strain at yield | Stress at yield | Young modulus |
Africana | 5.149 | 0.17920 | 1.5223 | 1063.2 |
Inversa | 10.223 | 0.74125 | 3.0492 | 1716.1 |
LSD | 1.788 | 0.2099 | 0.6396 | 708.37(NS) |
M.C(%) |
6.85 | 10.455 | 1.3281 | 1.9643 | 557.0 |
14.85 | 8.883 | 0.1633 | 3.0517 | 1747.5 |
21.85 | 5.572 | 0.1669 | 1.9975 | 1475.8 |
28.85 LSD | 5.833 2.529 | 0.1826 0.2969 | 2.1294 0.9046 | 1778.4 NS |

IJSER © 2015 http://www.ijser.org